Introduction guide to technologies for vision AI
The technologies that enable visual AI are better and more cost-effective than ever, yet big organizations still face challenges in scaling visual AI initiatives.
To scale visual AI projects fast and cost-effectively, organizations can use a platform that offers all the components for data aggregation and contextualization, visualization, application development, and deployment.
An introductory guide to technologies that enable visual AI
If your organization wants to use visual artificial intelligence, you can now do so faster and at a lower cost than ever before.
This article summarizes key technologies that enable visual AI. It tells you where to expect your biggest challenges in scaling your visual AI program. And it describes the role of visual AI platforms as an important part of the technology stack for overcoming the challenges.
Seven categories of technology that enable visual AI at scale
You can work with some aspects of visual AI on a small scale, using a limited assortment of technologies. But to scale a visual AI program across a big organization, you’ll need all 7 of the following categories of technology:
- Data collection: This category includes a variety of cameras and sensors for near and remote imaging. It also includes a variety of delivery vehicles and a portfolio of third-party service providers that offer big data and visual imagery. Organizations in various industries may also need indices for interpreting visual data. Such indices are algorithms that help make sense of raw data collected by cameras or other visual sensors.
- Networks: Wireless networks and the internet enable fast, low-cost streams of large amounts of data.
- Cloud infrastructure: +mElastic computing provides almost unlimited processing power when you need it. You needn’t buy and operate expensive hardware. Storage, security, backup and retrieval, and disaster recovery services are also available through the cloud. You can set up your own infrastructure on your premises or hire services from contract data centers.
- AI frameworks: When you implement visual AI, you will need algorithms and models. You can develop your own algorithms, leveraging open frameworks such as Pytorch, Tensor Flow, or Caffe. Most AI companies also provide data science expertise and services to build models for their clients.
- AI engineering: You need tools that manage all the processes and workflow involved in deploying visual AI. The processes include model performance analysis, retraining, and more.
- Data visualization: You need software that enables you to visualize the data, then present it in ways that are easy to interpret.
- Interfaces: You need technologies to integrate data from various sources. You must translate or convert data across dozens of formats, and you must share data across a variety of systems. Application programming interfaces (or APIs) enable easy sharing of data among systems as diverse as geographic information systems (GIS), farm management systems (FMS), accounting systems, enterprise resource planning (ERP) systems, and dozens more.
What are visual or spectral indices?
Indices are algorithms that transform raw visual data from a camera or sensor into a form that’s useful for analysis. Sensors or cameras aboard satellites and aircraft take pictures that consist of picture elements or pixels. Pixels make little sense until one or more algorithms have processed them.
Spectral indices measure and interpret the light reflected by surfaces you want to evaluate. They measure reflected light of two or more wavelengths to reveal the relative abundance of features you want to measure.
Some spectral indices are especially useful in mining, agriculture, geology, land-use planning and mapping, and earth or environmental sciences. For example, hundreds of vegetation indices have been developed for use in agriculture, forestry, and environmental studies.
Technologies are widely available at reasonable cost
Most of the preceding categories of technology have improved dramatically in the past decade and have become much more accessible.
The advancements now enable what you might call the democratization of visual intelligence. Organizations of diverse sizes can now use vast amounts of visual data for new applications across many industry segments.
Diverse fields of study intersect with visual AI
Many formerly separate fields of science and technology are converging. The convergence is happening, in part, because organizations can now get so much data from diverse sources with real-time integration and analysis.
Diverse fields of study intersect with visual AI
Visual AI makes use of these fields of study and more:
- Geographic information systems
- Telematics and the Internet of Things (IoT)
- Geospatial imaging and photogrammetry
- Remote sensing
- Video streams
- Robotics
- Virtual reality
- Computer vision
Geographic information systems create, manage, analyze, and map many data types. They help users understand patterns, relationships, and geographic context.
Sensors and cameras go everywhere as sizes shrink and costs drop
Earlier, satellites or aircraft collected data through cameras that were massive. Today, sensors for data acquisition are portable, affordable, and almost everywhere. For example, you can collect visual data from inexpensive drones or smartphones. And you can combine it with data from sensors connected by the Internet of Things (IoT).
About 5 billion cameras will be in use around the world in 2022. That’s an increase of 220% over 2017. Data that used to be available only to big organizations are now available to almost anyone with a smartphone. Inexpensive stationary cameras can now operate in networks to produce a new kind of closed-circuit television (CCTV) for security or monitoring.
Satellite data becomes more accessible
Even remote-sensing technology can now deliver time-sensitive spatial data in or near real-time. Next-generation satellites, including SmallSats and CubeSats, are gaining popularity because of their low cost. They also cater to the need for temporal resolution. You can scan the same areas often to detect and measure minute changes.
A company called Planet uses agile satellites to capture the entire surface of Earth every day.
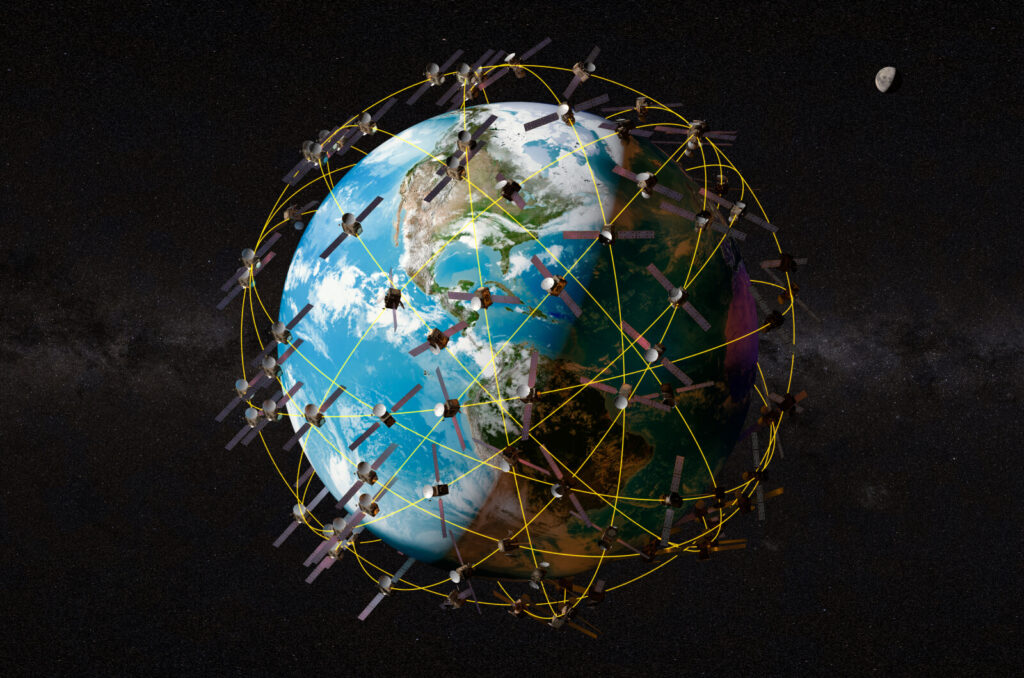
Remote-sensing satellite technologies are mature. They collect data from the entire surface of the globe every day.
High-quality unmanned aerial vehicles cost less than some widescreen LED TVs
Smart unmanned aerial vehicles (UAVs) can deploy a growing array of sensors, and they are becoming more automated. For example, Skydio offers a commercial drone that can autonomously capture 3D images of any structure or scene at ultra-high resolution. It costs a little more than $1,000.
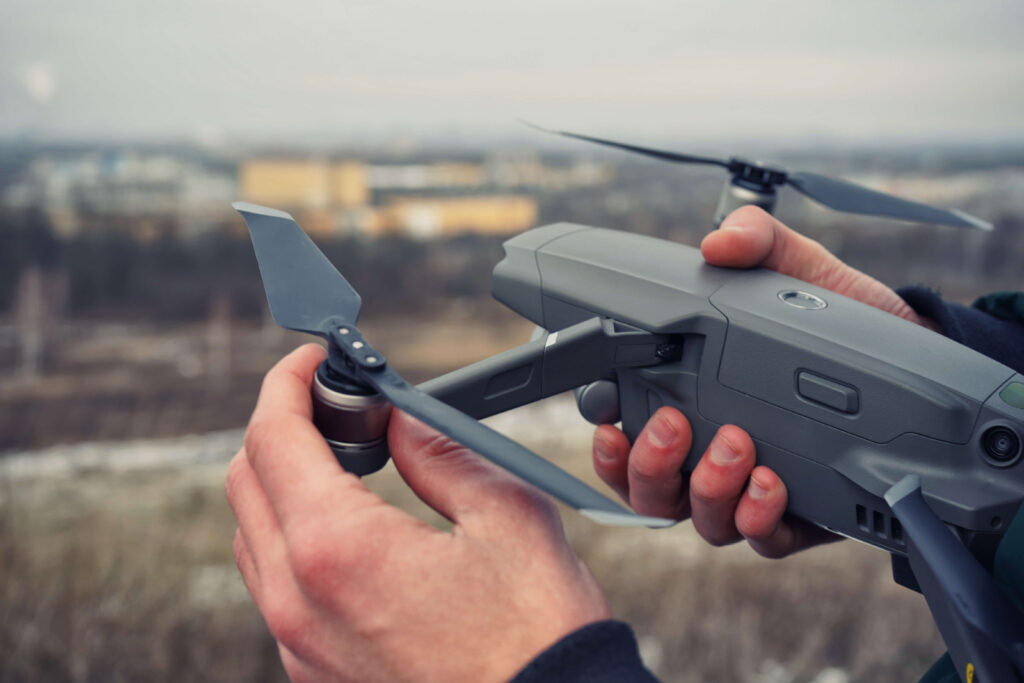
Unmanned aerial vehicles include rotary-wing and fixed-wing drones.
Recent technologies enable accurate sensing of nearby objects
Sensors may also be in stationary or mobile sources on the ground, including robots, pedestrians, webcams, and laser scanners. Smartphones and tablets contain ultra-high-resolution cameras, laser and LiDAR scanners, and more. Apple’s iPhone 12 and the iPad Pro introduced LiDAR scanners that can scan the volume of small spaces and create point clouds using inexpensive software.

Recent models of the iPhone and iPad Pro contain small LiDAR scanners.
The use of hand-held 3D laser scanners is expanding to new segments of users. They include applications in reverse engineering, quality control, 3D printing and prototyping, and visual simulation.
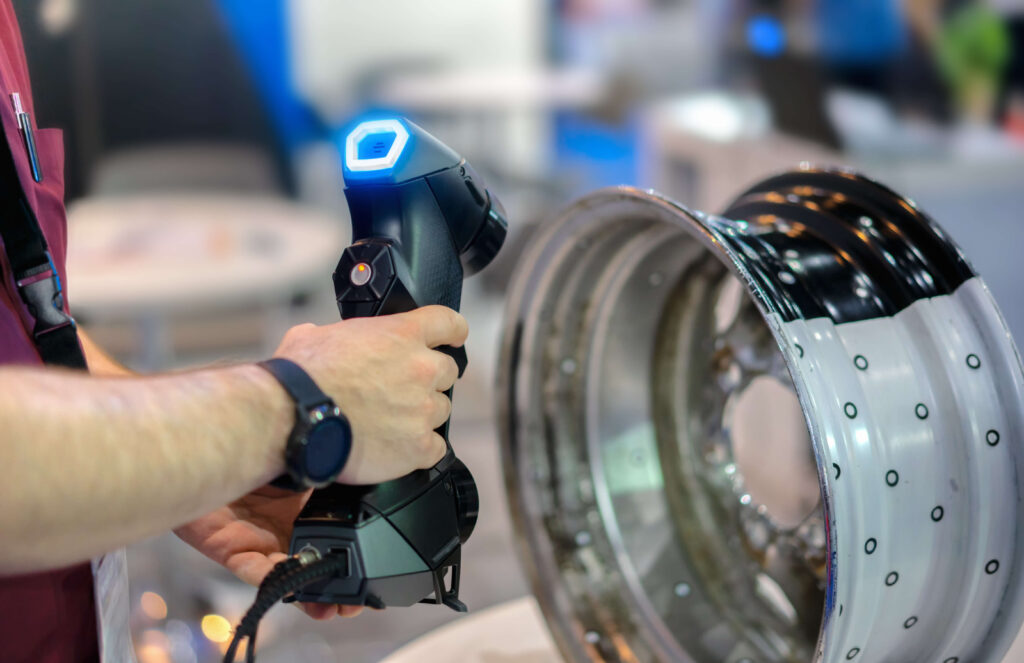
A technician scans a part before loading the 3D image into a computer-aided design (CAD) system.
Sensors deliver data in diverse forms and formats

360 photography captures an image of the entire area surrounding the camera. Imagine printing this image on paper and curling the paper to form a cylinder with the image inside. The left side of the image connects to the right side. If you place the cylinder around your head, you have a true 360-degree view of the scene as you turn your head.
Visual data comes in many forms and formats:
- Photographic images and videos in a variety of file formats
- LiDAR and visual point clouds
- Radar, thermal, ultrasonic
- 2D, 3D, 4D, 360
- RGB, infrared, multispectral, hyperspectral imaging
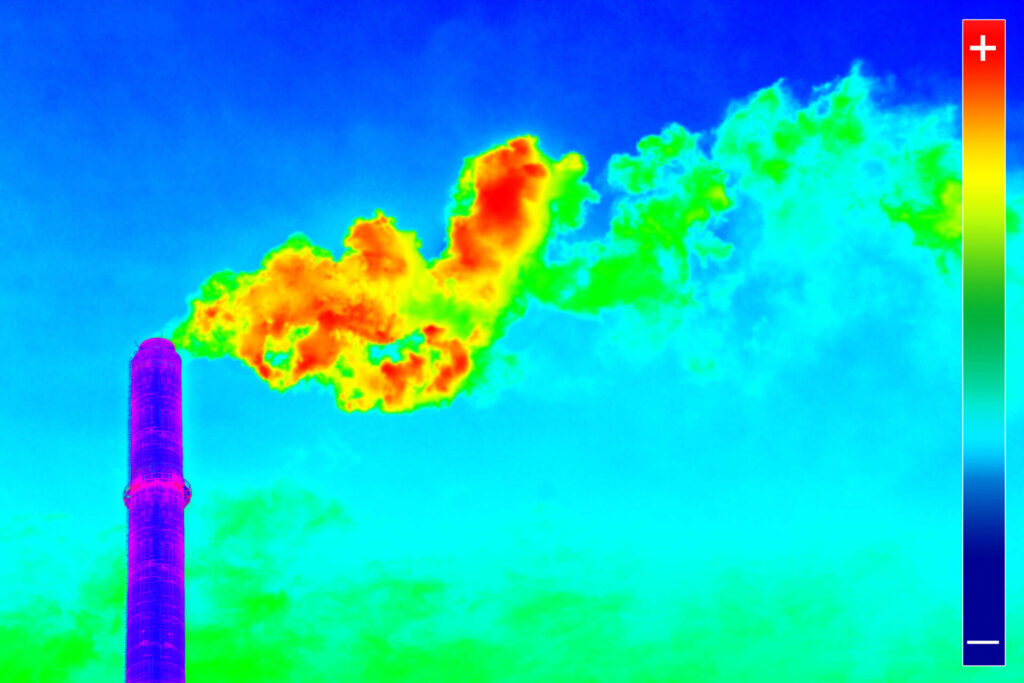
Infrared imagery measures heat from a distance. A thermal image shows the temperatures of areas within an exhaust plume.
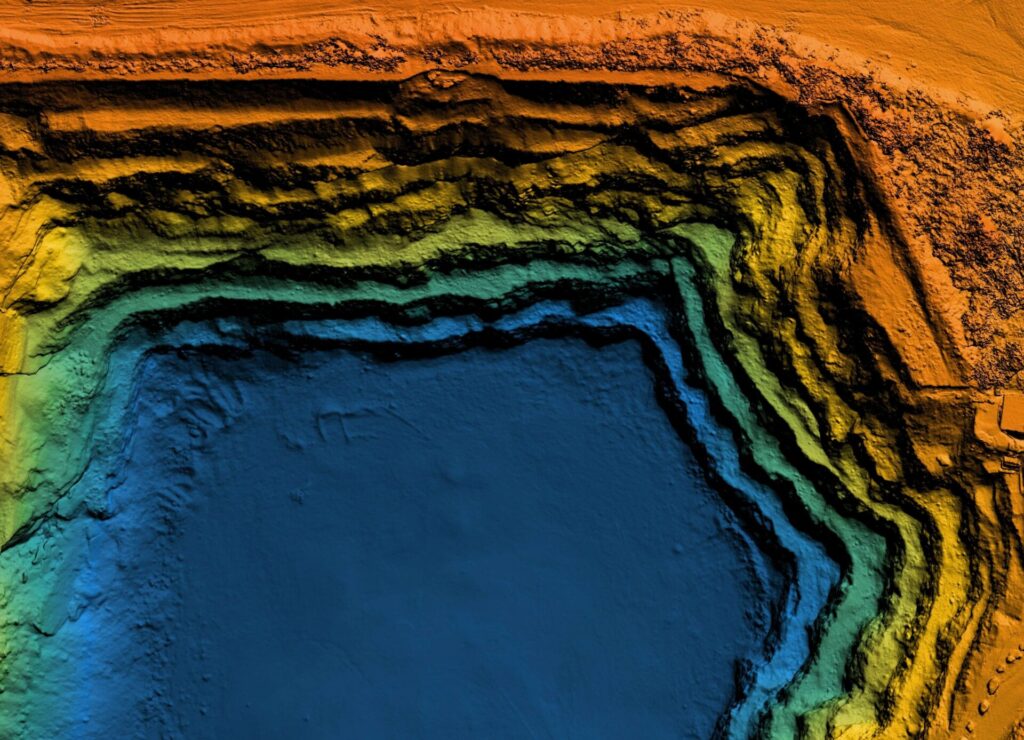
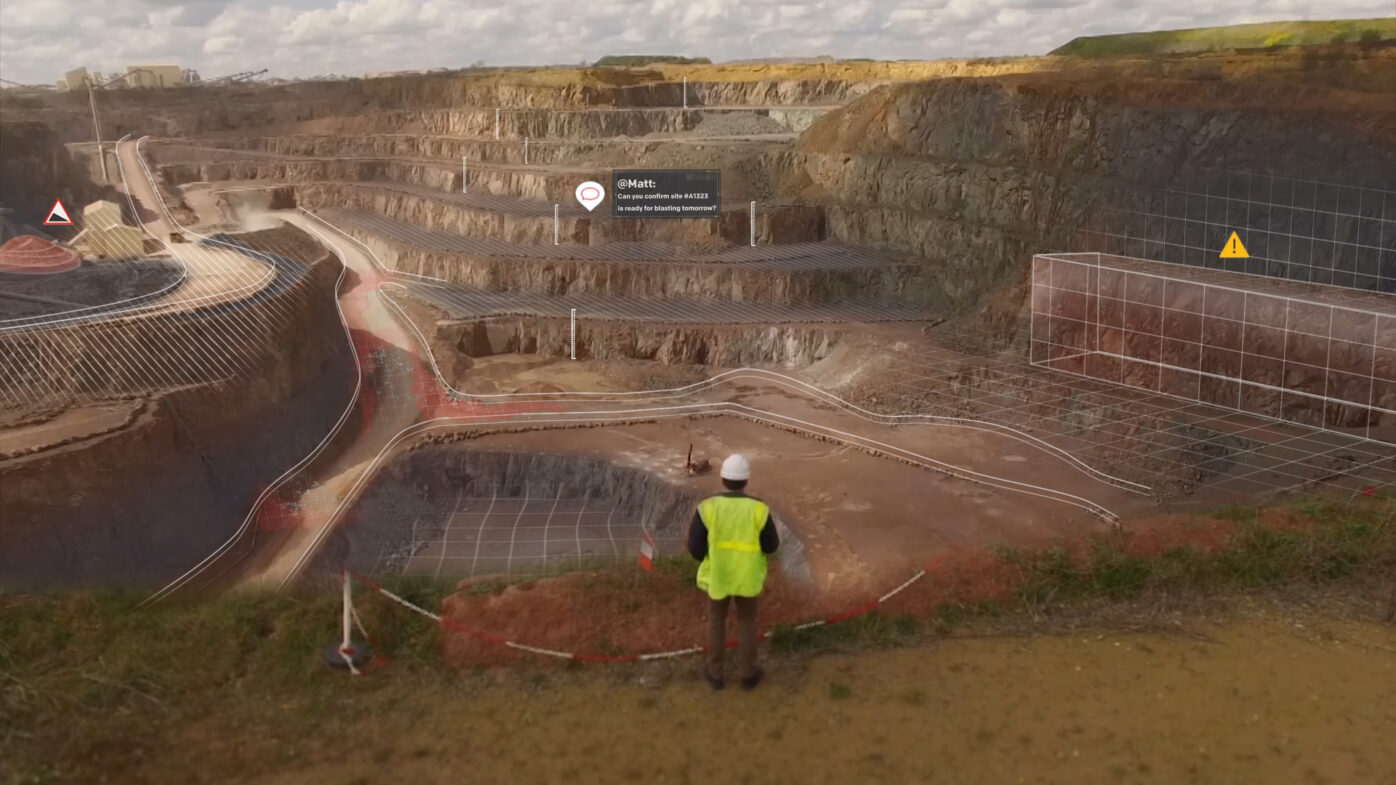
LiDAR images capture big 3D objects with great accuracy. A LiDAR point cloud of an open-pit mine shows the relative depth of the mine’s steps or benches. Depending on the spatial resolution of technology used, LiDAR scans can be accurate to within a few millimeters.
Processing power, networks, and software achieve huge gains
Computing power and software for visual intelligence have also improved exponentially. Less than a decade ago, organizations had to process images on expensive computers running local software.
Today’s giant network of internet-connected devices provides a continuous source of inexpensive data that can be processed 50 times faster and stored at a much lower cost. In addition, applications that run on the web or in the cloud enable users to visualize large amounts of spatial data leveraging elastic computing.
Challenges remain in managing enormous volumes of visual data
Despite progress in sensors that acquire visual data, such technologies are only a small part of the full solution organizations need to put visual data to work at scale.
To use large volumes of visual data, organizations must first aggregate and contextualize it. Then they must process, analyze, and present it for easy visualization and analysis. They must also manage the workflow to store and retrieve data in the right places and launch processes at the right times and in the right sequences.
Here’s an overview of all the elements you must manage:
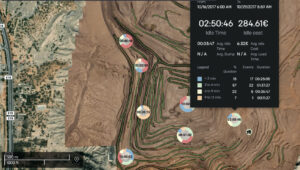
- Workflow. If you gather data from drones, you must schedule and manage flights and pilots. You have similar tasks for data you may gather from other sources.
- Data contextualization. You will want to combine video and still images with data from various sources, including GIS, LiDAR, or telematics data, so all your data “speaks the same language.” You will then overlay data from these various sources in a visual context that makes sense to the users of your systems.
- Algorithm development and management. You may want to create your own proprietary algorithms. Or you may choose to use off-the-shelf algorithms from a library that licenses their use. You must choose which algorithms to use and when. Then, you’ll want to build that selection and process into your workflow.
- Data storage and processing. You will want to save your high volumes of visual data where it’s easy to access and share. You will want access to enough computing power to process the data to make it useful quickly.
- Data analysis and visualization. You may want to output data from your visual intelligence system into CSV files for analysis in spreadsheets or other data visualization and reporting software.
- Integration. You will want to integrate your visual intelligence system into other enterprise systems your company uses, such as asset and maintenance management software, enterprise resource planning systems, and many more.
- Data governance and security. You will provide appropriate data governance and security that align model performance, human validation, and delivery of business value.
- Monitoring. You need to deploy tools to ensure that the business value of models can be actively monitored and maintained as needed.
This is a lot to manage—especially when you’re under pressure to deliver benefits fast.
Visual AI platforms can do much of the work for you
Service providers offer elements of the many technologies that support visual AI. But with few exceptions, you must create the infrastructure you’ll need to make those technologies work at scale.
Alteia has taken a different approach. We offer a platform you can use to manage data aggregation, contextualization, and visualization at enterprise scale. If you aren’t ready for such a platform, consider Alteia’s SaaS applications suite that enables data acquisition and analysis for specific uses.