Climate change: three challenges in detecting and measuring methane emissions (and how vision AI can help)
The United States and the European Union have committed to reducing methane gas emissions, a major contributor to climate change. The governments announced their commitment at the COP-26 conference in Glasgow in November.
The technology for remote sensing and measurement of methane is well established. Yet many organizations in both government and industry will struggle to collect, process, and analyze data about methane emissions at scale.
This article shares three of the key challenges organizations face in collecting and applying methane-emissions data. It also suggests one effective way to overcome two of the challenges by using Visual Artificial Intelligence, or visual AI.
Why is methane a problem?
Methane is an invisible atmospheric gas with high global warming potential. In a 20-year period, it warms the planet up to 86 times more than carbon dioxide (CO2).
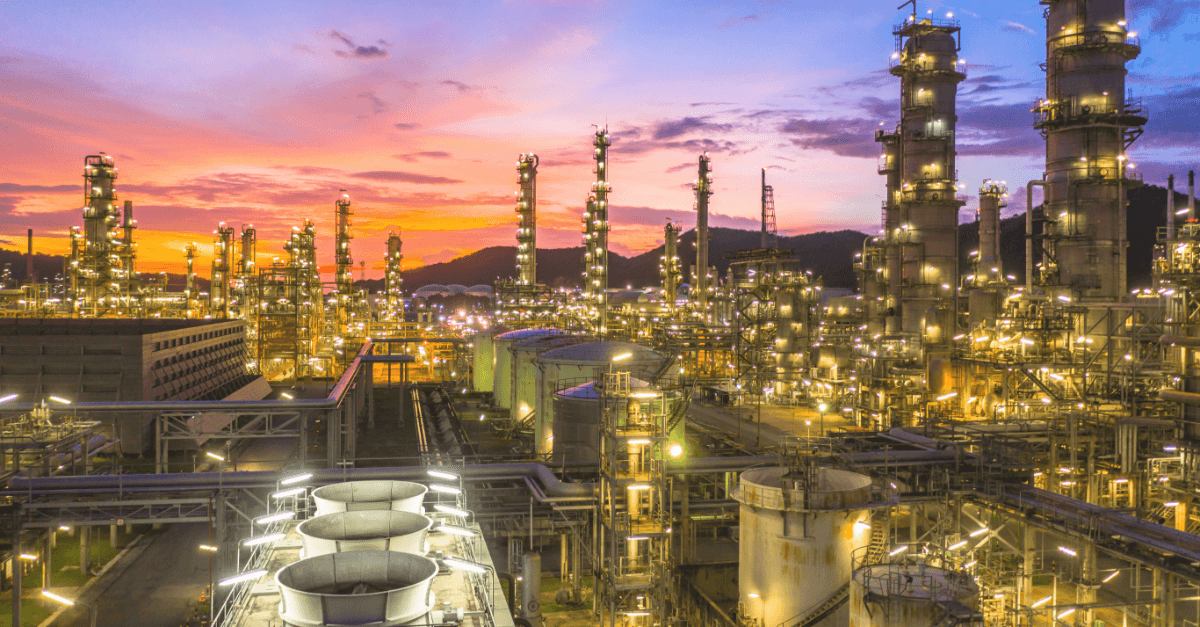
Governments expect to limit the effects of climate change by reducing methane emissions. The primary focus of U.S. methane controls will be to reduce emissions from oil and gas extraction and processing.
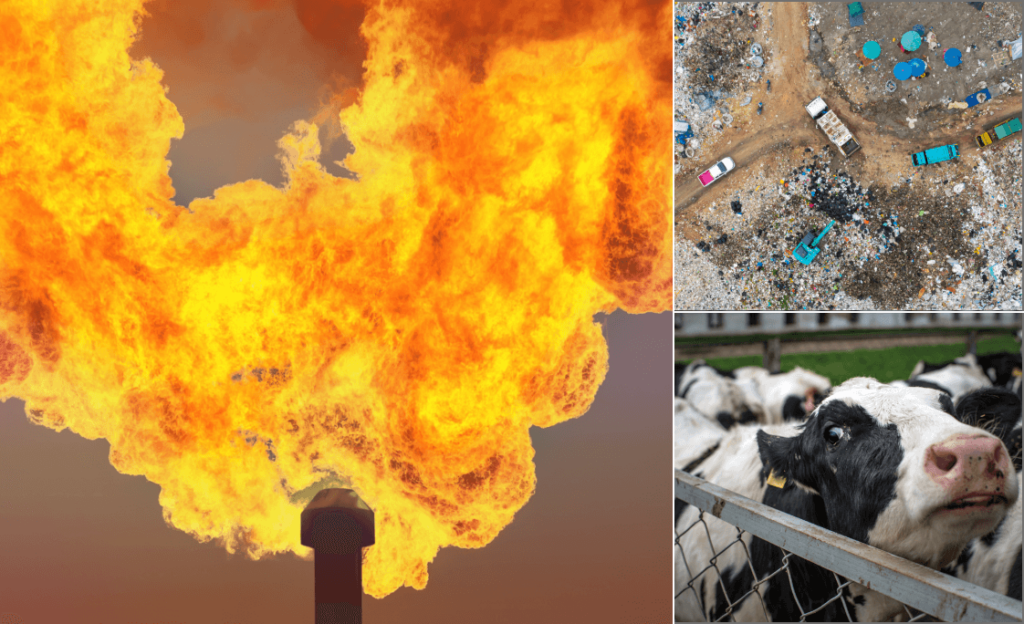
Today the regulatory mandate is for oil and gas companies to monitor, measure, and control their release of methane. In the future, methane monitoring may also become a higher priority for companies in waste management, agriculture, and other industries.
Challenges of measuring methane releases
Challenge one: accurate detection through remote sensing
To control methane emissions, you must locate their sources and measure their relative volume. It’s easier to detect sources of methane than to measure their emissions. To varying degrees, organizations need both detection and measurement to ensure accountability for reductions.
Current technology offers several alternatives. Cameras and other sensors for optical gas imaging, or OGI, may be mounted on satellites, manned and unmanned aircraft, aquatic craft, terrestrial vehicles, and fixed locations. The cameras use hyperspectral imaging to capture visible and infrared wavelengths.
Methane is hard to measure because it’s a gas and it’s explosive. Gas plumes can disperse fast, depending on wind speed and other atmospheric factors. So how can you monitor, measure, and reduce methane emissions across multiple sites and across national borders?
Challenge two: managing complex algorithms and terabytes of visual data
To measure the amount of methane released, you need the leak rate and wind speed and direction. You also need algorithms to calculate the effects, possibly in real time.
For accurate measurement of methane releases from specific sources, you need temporal resolution. You must gather data often enough to see the changes in time increments that matter to you. Depending on the geographies and the scope of operations you monitor, you’re likely to generate huge amounts of unstructured data from various sensors.
Challenge three: applying and interpreting visual data in practice
Organizations that undertake methane tracking may be unprepared to process the volume of data their sources will generate. They may find themselves at pains to deliver value from the data they’ve collected.
In building visual intelligence capabilities, organizations often focus most of their attention on adopting technologies to collect data. They spend little on scaling their data-management capabilities. Then they face setbacks when they try to expand their volume or develop other uses of visual intelligence. This tendency is common across many early deployments of visual artificial intelligence.
Organizations need a visual intelligence platform to reduce methane emissions
In contrast, organizations that have built or outsourced a proper platform can scale their use of visual AI fast. Visual AI can then help solve persistent problems for which no other solutions work as well.
With the right infrastructure in place, companies and government bodies can incorporate vast amounts of visual data into the moment-by-moment pulse of their operations.
What you need in a data platform for scaling visual AI
What is the right architecture for making visual AI work at scale? Your data platform should enable three stages of data processing and analysis:
- Fuse: You integrate, unify, and contextualize data streams from various sources. You combine internal and external data into a single logical data image.
- Build: You create models for machine learning or ML. You may choose to speed up your development of AI by creating your own models. Or you can use pre-build models from an external developer.
- Deploy: You establish AI applications and operations across your organization. Your goal is to transform your data into valuable business insights and to do so fast. You improve and adapt your data and processes in real time.
The steps to building a scalable visual intelligence workflow
The foregoing stages offer a high-level overview. To achieve visual intelligence at scale, you must figure out how to execute:
- Workflow: If you’re gathering data from drones, you must schedule and manage flights and pilots. You have similar tasks for data you gather from other sources. You will want to combine video and still images with data from various sources, including LiDAR point clouds. You will then overlay data from the various sources in a visual context that makes sense to the users of your systems.
- Algorithm development and management: You may want to create your own proprietary algorithms for methane detection. Or you may choose to use off-the-shelf algorithms from a library that licenses their use. You must choose which algorithms to use and when. You’ll want to build that selection and process into your workflow.
- Data storage and processing: You will want to save your high volumes of visual data where you’ll have easy access to it. You will want access to enough computing power to process the data fast enough to make it timely and useful.
- Data analysis and visualization: You may want to output data from your visual intelligence system into CSV files for analysis in spreadsheets or other software for data visualization and reporting.
- Integration: You will want to integrate your visual intelligence system into other enterprise systems your company uses, such as asset and maintenance management software, enterprise resource planning systems, and many more.
- Data governance and security: You will want to manage data security. You may want a single sign on, and you will want to restrict access to certain kinds of data by job role, location, business unit, and so on.
- Change management: You must involve the users in your organization at every stage of the process. This will help ensure they follow the newly defined workflow. You must also define metrics for success and iterate when necessary.
This is a lot to manage—especially when you’re under pressure to deliver benefits fast.
To simplify and speed your implementation, consider using a visual AI platform
Organizations need not build such infrastructure for themselves. Today you can subscribe to a class of solutions known as AI platforms as a service, or PaaS. Several solid PaaS providers offer a variety of choices and price points, each with its own strengths. Most visual AI platforms are best suited for bigger organizations.
An effective infrastructure can help your organization adapt new visual AI applications much faster and at lower cost than by building your own. With a PaaS designed for visual AI, you can deploy a visual AI application in weeks. Then you can refine your application and roll it out across your enterprise within a few months.
You can use a visual AI platform for applications other than methane monitoring
Industries that don’t emit methane or other greenhouse gasses have found many other profitable uses of visual AI. Manufacturers use it to ensure consistent quality and high throughput in intricate manufacturing processes. In the mining and aggregates industry, companies use visual AI for these applications and:
- To optimize drilling and blasting operations.
- To improve mine safety and ensure regulatory compliance.
- To plan production, increase throughput, and measure stockpile inventories.
- To optimize haul roads, reducing maintenance cost and fuel consumption for haul trucks.
In agriculture, crop breeders use visual AI to develop and test new plant varieties. One has cut 3 years from what had been a 10-year cycle. Organizations in over seven industry segments use Visual Intelligence to boost productivity and reduce costs.
You’ve seen that accurate detection and monitoring of methane emissions involves much more than collecting accurate data. Data collection is only about 2% of what you’ll need. To scale your use of visual AI, you must be able to execute the remaining 98%. You need not develop all those capabilities in house. You can hire a trusted partner to provide, implement, and manage a full visual AI infrastructure for you.
With a visual AI platform offered as a service, you can start your implementation at whatever scale you want. Then you can expand it to more locations and other applications. You can do so much faster and more cost effectively than by building and managing your own infrastructure.
Let Alteia serve as your guide. We’re here to help make you a hero in your company’s adoption of visual AI. For more about practical uses and implementation of visual AI, follow Atleia on LinkedIn.
Dig deeper
For more on monitoring and measuring methane emissions, see these resources:
“Low-Altitude Aerial Methane Concentration Mapping.” Bara J. Emran, Dwayne D. Tannant. Homayoun Najjaran. August 10, 2017. MDPI. The University of British Columbia School of Engineering. [Online article]
“California’s Massive Gas Leak Prompts New Interest in Detection Technology.” Ucilia Wang. January 15, 2016. The Guardian. [Online article.]
Climate Change 2021: The Physical Science Basis. Intergovernmental Panel on Climate Change (IPCC). November 2021. [Downloadable PDF. 3,949 pages. Ungated. No charge.]
“Major U.S. Cities Are Leaking Methane at Twice the Rate Previously Believed.” Sid Perkins. July 19, 2019. Science. [Online article.]
“Methane Emissions: Is Measuring It a Real Challenge?” Futurebridge blog. December 12, 2019.
“Methane Emissions from Oil and Gas – Analysis.” International Energy Agency (IEA). November 2021.
UN Global Methane Assessment: Benefits and Costs of Mitigating Methane Emissions. United Nations Environment Programme. Climate and Clean Air Coalition. May 6, 2021. [Downloadable PDF. 173 pages. Ungated. No charge.]
UN Global Methane Assessment: Summary for Decision Makers. United Nations Environment Programme. Climate and Clean Air Coalition. May 6, 2021. [Downloadable PDF. 14 pages. Ungated. No charge.]