Optimizing production in open-pit mines: digital models and simulations using vision AI as a data source
How mines and quarries run simulations today
Mine and quarry operators can build digital models of their operations using a broad range of tools. The tools range in complexity from spreadsheets to software provided by equipment manufacturers like Mine star provided by CAT.
Operators then create their simulations with data that specifies the operating performance of machines they use in production. Manufacturers provide detailed data for their equipment, including operating speeds, load capacity, cycle time, fuel consumption, and much more.
Some manufacturers also provide software tools and helpful guidance on how operators can use equipment data to simulate their production in various scenarios.
Data and training from equipment makers are important for running good simulations. But they are not sufficient.
Why equipment specs are not sufficient for accurate simulations
A CAT 775 haul truck has a nominal capacity of 70.5 tons and a maximum payload of 84.6 tons (U.S.). That’s useful and accurate data from the manufacturer.
But it’s of limited use in simulating the productivity of a specific site.
On-site, operators may load haul trucks at a different level than their nominal capacity. For an accurate simulation of productivity at that site, it’s more accurate to know the average truckload rather than its nominal capacity.
Similarly, the manufacturer’s specs for haul trucks specify normal speed ranges and fuel efficiency at various load sizes, assuming haul roads with a given slope and well-maintained surfaces. But if your haul roads are heavily rutted or strewn with debris, the manufacturer’s performance specs are less useful in modeling your production.
How vision AI improves mine and quarry simulations
Vision AI systems enable mines and quarries to gather rich, precise, and timely data about their operations at a site level.
The data collected in a vision AI system may be available as digital twins, or point clouds representing the mine site in three dimensions. Such data is typically captured by manned or unmanned aircraft outfitted with LiDAR technology or aerial images. Depending on how the data are gathered, they can be as precise as a few centimeters in many square kilometers.
Other data in a vision AI system may include these elements and others such as:
- Accurate sizing of stockpiles or volume of material loosened by blasting
- Precise geometry and condition of haul roads
- Distances between any points in the mine
- The exact placement of mining equipment
- Precise safety implements
Such data can provide an accurate picture of the mine’s actual production. You can easily export it to a spreadsheet or other form of the digital model to run highly accurate simulations of local conditions.
How the copper mine used digital twin data in its simulations
Let’s return now to the big copper mine we mentioned at the beginning of this article. For their simulations, they used data they exported from the Alteia platform. Then they loaded that data into digital models of their operations.
They ran multiple simulations, each testing a different scenario. For each scenario, they changed the input data to reflect different assumptions about the mine operations.
The simulations suggested the site could achieve a desirable balance across its three goals by:
- Adjusting the grades of key sections of haul roads
- Increasing the average speed of haul trucks
What you can learn from the mine’s experience
Not all mine operators have the same incentives to improve their production. Yet most operators can benefit from understanding this new way to run simulations.
The rest of this article explains, at a high level, how to create and run specific models to optimize a mine’s operations. Companies other than mines and quarries (manufacturers, for example) can also use digital models and the scalability of a vision AI platform to optimize production in similar ways.
To make this article applicable to a wider audience, it explains the mining and aggregates industry in terms that outsiders can easily understand. The hope is that you will see how you can apply similar approaches in your own business, even if you’re not in the mining and aggregates industry.
Let’s start with the key takeaways.
Digital twins provide a fast, low-cost way for operators to test scenarios for increasing production
Many mine and quarry operators have been using digital simulations for years. For companies that have not used such simulations, it is worth noting:
- You can use simple, no-code, or low-code software tools to build digital production models.
- Such digital models enable you to test and compare various scenarios to improve operations.
- You can simulate likely outcomes of your scenarios without spending millions of dollars to test them in reality.
- The accuracy and reliability of digital simulations are only as good as your models and the data you feed them.
The following insights are likely to be new, even for operators with long experience using digital simulations:
- It’s valuable to know the speed, capacity, fuel efficiency, and other manufacturers’ specifications for mine-site equipment such as loaders and haul trucks.
- But the actual performance of mine equipment varies from site to site. And that variance depends on each site’s physical characteristics and production volume.
- Manufacturers’ performance specs are of limited value without site-specific data in creating accurate simulations.
- Mines and quarries that use vision AI systems can efficiently produce data that makes production simulations much more accurate.
We’ll talk first about how mines and quarries must seek a profitable balance among the constraints under which they operate.
Then we’ll explore how digital simulations work. And finally, we’ll explain the mining engineer’s design behind her simulation for the South American copper mine.
In conclusion, we’ll share ideas about this and other potential uses of vision AI in digital production modeling.
Mining companies must balance three big tradeoffs
Mining companies seek to find an optimal balance among measures that can help them achieve three competing goals:
1. To increase the throughput, productivity, and profitability of their operations
2. To reduce adverse environmental effects of their operations, including carbon emissions
3. To achieve regulatory compliance and ensure the safety of their employees
If a mine improves its performance against one of these goals, it may reduce its performance against the others.
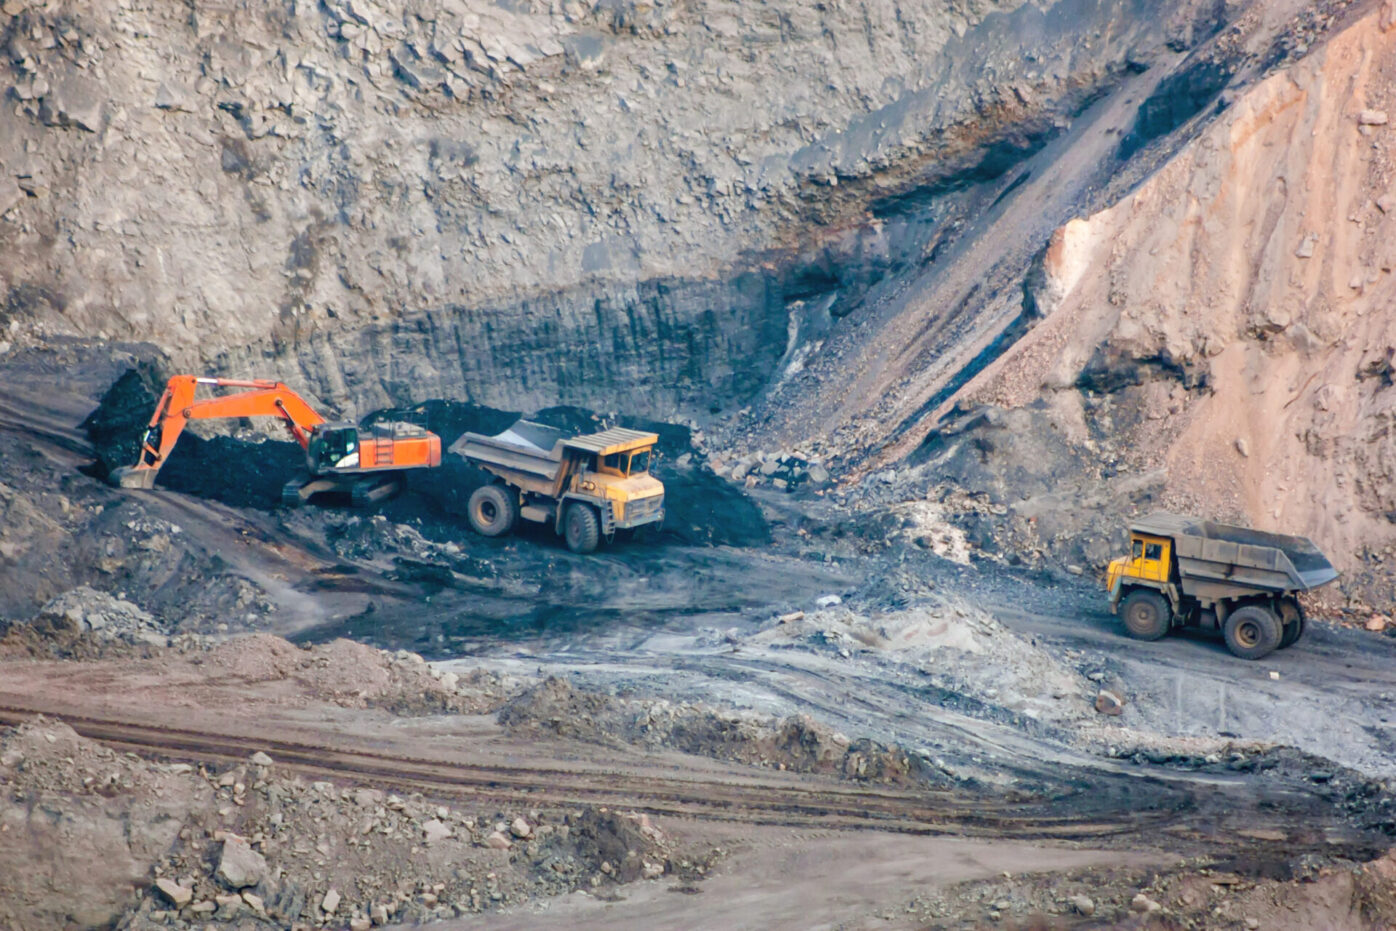
Open-pit mines use huge, high-capacity dump trucks the industry calls haul trucks. (See Figure 1.)
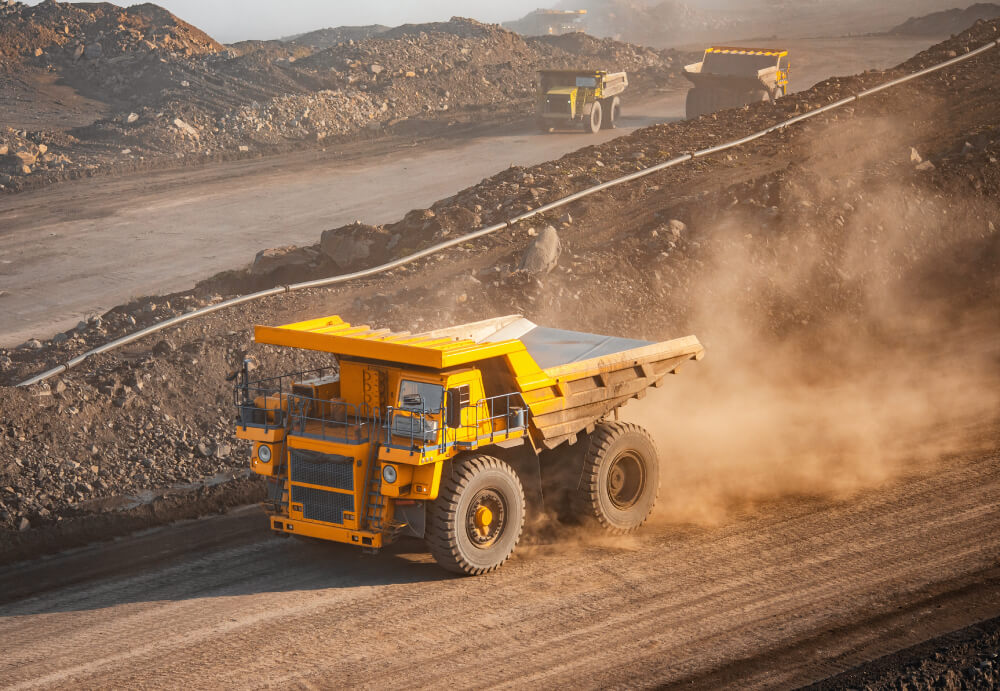
Figure 1. Haul trucks vary in size, capacity, operating speed, fuel consumption, and other performance characteristics.
For example, a mine might improve its throughput by changing any of these variables:
- Filling its current fleet of haul trucks to their full capacity
- Upgrading its fleet of haul trucks to increase their load capacity
- Increase average driving speeds to complete cycles faster
An upgraded fleet of higher-capacity haul trucks could move more production in fewer truckloads.
But larger haul trucks are likely to consume more fuel and generate more carbon emissions. They also move at lower speeds. So, in this case, the use of larger haul trucks may not achieve all the company’s production goals.
A decision to use larger trucks would likely increase the mine’s capital costs. Buying the trucks may increase or decrease the mine’s maintenance costs. And it would likely affect fuel efficiency and carbon emissions.
Mine operators must also consider the effects of their decisions on mine safety and regulatory compliance.
These are important topics to weigh before the mine commits to investing in one alternative versus another.
Mine operators face unforgiving economics
Mining involves high costs for capital equipment, energy, and labor.
The profitability of mine operations depends mainly on three factors:
- Pricing. The current market price of commodities the mine produces. This market price is mostly beyond the control or influence of the mine.
- Total production. When prices are high, the mine can choose to produce more. When prices are low, it can choose to produce less.
- Efficiency and throughput. Mine operators can improve the efficiency with which their sites extract materials from mines, transform the materials into products the company can sell, and deliver those products to its customers.
Because mines have little control over their selling price, they increase their profits mainly by improving their production and efficiency.
Besides focusing relentlessly on efficiency and productivity, operators must also comply with heavy regulations under which they often operate. The regulation of mines occurs for three main reasons:
-
-
- Mining disrupts the environment. Blasting generates loud noises and shock waves, while heavy equipment pollutes the air and emits carbon dioxide. Mine tailings may pollute local water supplies, mining operations may damage wildlife habitats, and mine traffic can put stress on local roads. Because uncontrolled mining can adversely affect nearby communities and ecosystems, governments regulate mines to reduce those potential effects.
- Mining often occurs on leased public land or near populated areas. Governments have an interest in ensuring that mining operations take proper care to protect the areas that surround them.
- Mining is among the most hazardous occupations in the world. Governments regulate mining operations to ensure they operate at a reasonable level of safety for workers and surrounding populations.
-
Digital models can help mine operators find an optimal balance among tradeoffs
Like firms in most other industries, mining companies look to achieve an optimal balance among key tradeoffs.
Mining operations have many alternative ways to achieve each of their key goals. But the cost of testing each possible alternative is likely too high for operators.
A site manager might try to make haul trucks more energy efficient. For example, they might try to reduce their fuel cost per ton of material hauled. They might also adjust the recommended driving speed of their haul trucks.
All these factors are interrelated. For example, a mine may have to reconfigure its haul roads to increase the average operating speed of haul trucks. But such reconfigurations may have implications for mine safety and regulatory compliance.
Simulations are valuable because it can be hard and costly to reverse decisions that don’t produce the results operators expect.
Why focus on haul trucks and haul roads?
Haul trucks are a significant source of carbon emissions in many mines and quarries. Figure 2 shows McKinsey data from an Australian open-pit mine that produces 25 million tons of iron ore per year. Haul trucks produce 20% to 25% of the total carbon emissions of this entire operation.
In most mines, carbon emissions from haul trucks are an important consideration in any scenario that seeks to balance production efficiency against environmental goals.
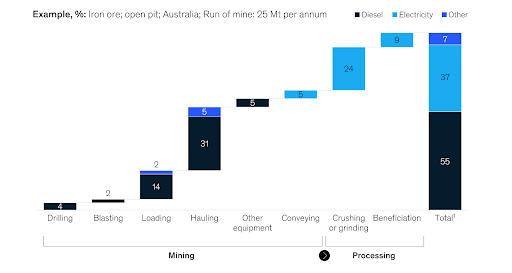
Figure 2. In one big open-pit mine, hauling emits much more carbon dioxide than any other operation. Source: “Creating the Zero-Carbon Mine.” June 29, 2021. McKinsey & Company.
How a big South American copper mine used vision AI in its simulations
Meet Carolina Castellanos, an application engineer for the mines and quarries industry.
Carolina previously worked at Sitech Construction Systems, a technology company that sells Trimble and Caterpillar equipment. Sitech mainly serves the construction industry and also works with mines and quarries.
At Sitech, Carolina had spent about two years creating digital models and running simulations of construction and mine sites.
In that work, she saw that simulations of mining operations often rely heavily on performance specs provided by equipment makers. She believes simulations don’t use enough data from the operations of local sites. Simulations that lack local data, she saw, are too generic to be as accurate and useful as they could be.
The main reason mines don’t use more local data is that it’s been hard to collect current, accurate data at a reasonable cost.
At Alteia, Carolina is working with our mining clients to implement the Alteia platform and deploy Alteia AI applications for mining. She got in touch with the operators of a big open-pit copper mine in South America that wanted to work on more relevant types of simulations for their mine. The mine site covers about 1,800 hectares. That’s roughly equal in size to about 2,500 football (soccer) fields arranged side by side.
The mine had recently implemented Alteia’s platform for vision AI. It did so as part of its strategy to digitize operations and take advantage of Industry 4.0 technologies.
The mine engages in four primary operations:
- Blasting
- Loading
- Hauling
- Crushing
Its productivity depends on achieving an optimal balance of production across these four operations.
The mine must also balance its production and efficiency goals against its goals for regulatory compliance, safety, and environmental impact.
Overview of the mine’s production processes
Let’s look at the five key steps in the mine’s production flow:
1. Miners identify where to extract enough ore to meet their production goals. The location they choose for extraction is called the working face of the mine.
2. If operators choose to blast material loose, they plan and execute their drilling and blasting tasks.
3. A piece of heavy equipment called a crawler loader (Figure 3) piles the ore onto a haul truck.
4. Driving on established haul roads, the truck moves the material from the working face to a dumping location closer to the mine entrance.
5. After dumping its load, the haul truck deadheads back to the working face for another load and transport cycle.
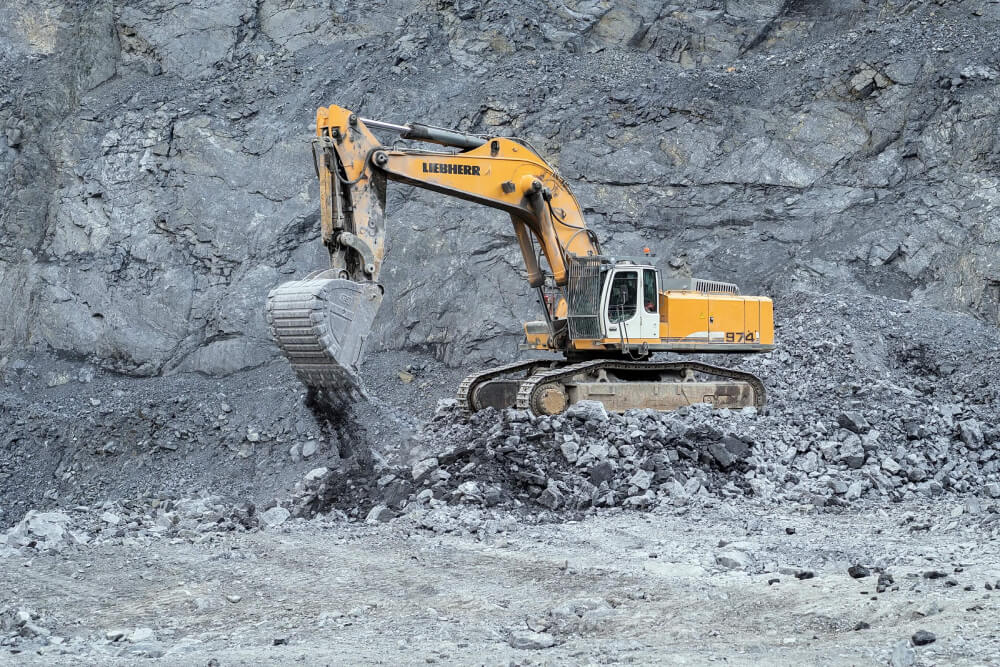
Figure 3. Crawler loaders used in surface mining come in a variety of configurations and sizes, each with different performance specs.
For the digital simulation Carolina proposed, she and the mine operators chose to focus on steps four and five in the preceding production cycle:
- A loader fills haul trucks at the working face.
- Haul trucks move material to a dumping location, and they return to the working face for another load.
Carolina and the mine operators decided to model two key factors related to the mine’s productivity:
- Use of haul trucks to move materials from point to point within the mine.
- The geometry and configuration of haul roads.
Key factors in optimization
Carolina designed a simulation that considered three main elements for which the mine wanted to optimize its operations:
- Mine throughput and production efficiency, including the cost of fuel
- Mine safety and regulatory compliance
- Environmental considerations
The following sections address each element in more detail.
Mine throughput and production efficiency
Carolina and the mine managers assumed the mine operates under constraints outside of their control:
- The maximum fuel efficiency, maximum hauling speed, and load capacity of haul trucks and loaders used on the site.
- The physical distance along the haul route between the working face and the collection point.
In their simulations, the team considered testing:
- The average load density and weight per load for both haul trucks and loaders.
- The geometry and condition of the haul roads between extraction and dumping locations.
- The number of round-trip haulage cycles completed per work shift along with the average driving speed of the trucks, and the number of trucks running delivery cycles.
- The weight and volume of ore in a loaded truck.
Mine safety and regulatory compliance
The team projected that the geometry and condition of haul roads and safety berms must meet regulatory and safety requirements, which the industry calls site specs.
Environmental considerations
The team also assumed the optimization must help increase their company’s goals to reduce carbon emissions.
How the simulation worked
Creating and running the simulation involved these steps:
1. Building a custom digital model of mine operations
2. Loading data inputs into the model
-
- Data about the physical characteristics of the mine, from Alteia’s vision AI platform
- Performance specifications for equipment used at the mine
- Telemetry data from equipment operated at the mine
3. Running various scenarios to generate data outputs
4. Comparing the results or outputs of each simulation to see which scenario performed best overall
The following sections describe each step in more detail.
1. Building a custom digital model
Carolina created a custom digital model of the mine’s operations, drawing on her experience building digital models at Sitech.
For people less experienced in building digital models, it’s probably easiest to start by creating a map of processes that affect the performance you want to simulate. Figure 4 shows the map Carolina used for this case study.
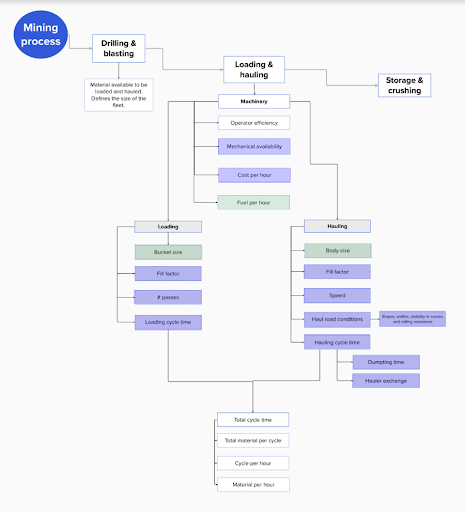
Figure 4. Before you build a model in software or a spreadsheet, it’s easier to start by mapping the processes to be modeled.
The boxes in green use data from machinery performance specifications provided by equipment makers. The boxes in blue are data inputs from local site conditions.
Note in this map that blue boxes outnumber the green ones, suggesting the relative importance of local data elements versus manufacturers’ machinery specs.
2. Loading data inputs into the model
Carolina’s next step was to load Alteia’s visual AI platform data into the model. That data included the precise physical characteristics of the site.
It also included telemetry data from equipment operating at the site. The mining company gathers telemetry data that shows time-stamped equipment speed and position.
The Alteia platform then contextualizes the telemetry data and superimposes it over digital layers of the mine site.
Carolina exported data from the Alteia system as CSV files she could quickly load into the digital model.
The data available from Alteia’s vision AI system included a digital terrain map (Figure 5) that plots every point on the surface of the mine in 3D.
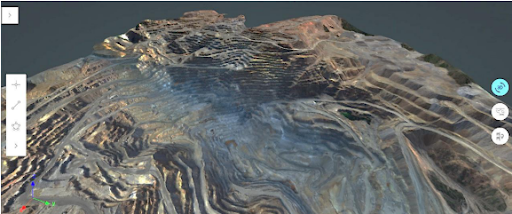
Figure 5. Inputs for the digital model included data from a digital terrain map of the mine.
Data in the mine’s vision AI platform also includes a map of the haul roads in the mine. Figure 6 shows the route of the haul road section used in Carolina’s simulations.
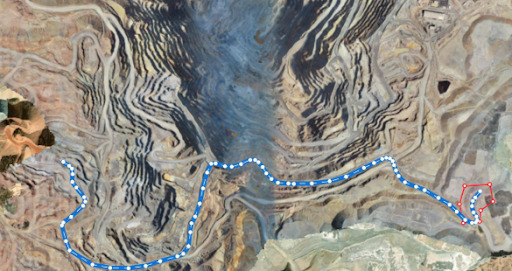
Figure 6. A Digital map plots the route of haul trucks from the working face to the dumping location.
Figure 7 is one of several digital maps the mine uses to evaluate its haul roads for safety and regulatory compliance. For road sections that appear in red, safety berms are out of compliance with the mine’s local site specs.
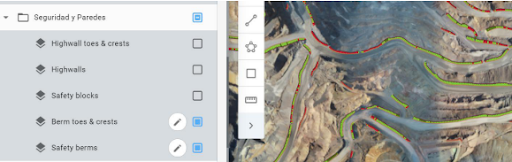
Figure 7. Digital maps highlight the condition of safety berms built along sections of the haul road.
The function of safety berms is to help keep equipment on the road and prevent it from overturning.
The site-specific data also included digital maps that show detailed haul road conditions (figures 8 and 9). These data are important for checking safe operating speeds for haul trucks. The images also show areas in the road that reduce the operating efficiency of the trucks.
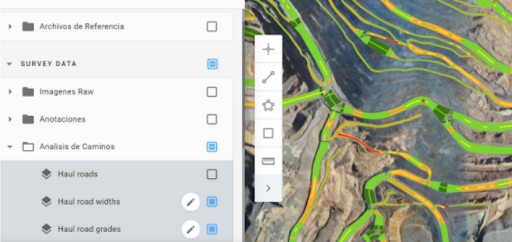
Figure 8. Digital map shows additional haul road conditions, including widths and grades.
Road widths and grades affect the safe operating speed of haul trucks. Road grades also affect fuel efficiency.
Rolling resistance (Figure 9) is another key factor that affects the operating speed and fuel efficiency of haul trucks. The metric refers to the irregularity of the road’s surface, which may be rutted, pitted, or strewn with debris—especially near the working face.
Rolling resistance increases with the load of the truck.
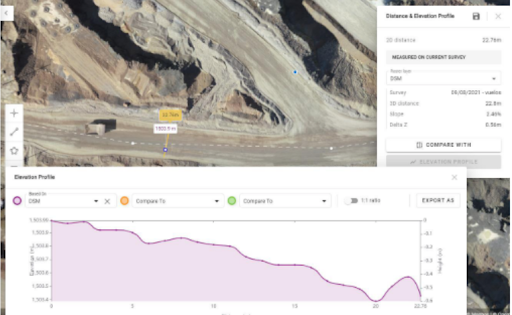
Figure 9. A digital map shows changes in rolling resistance in various sections of the haul road.
The actual driving speed of haul trucks (Figure 10) varies with the slope of roads and sharpness of turns. This digital map of haul roads incorporates telemetry data showing local vehicle speeds. Road sections shown in red have steeper slopes, and so reduce truck speed. They also increase fuel consumption.
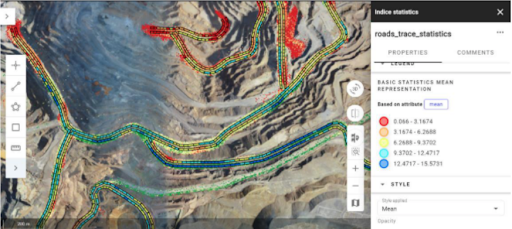
Figure 10. The driving speed of haul trucks varies with the slope and condition of the road in various stretches.
Next, Carolina collected four kinds of data that characterize conditions at the mine site. The operating specifications of machinery used in the simulation, provided by equipment manufacturers As well as data about the materials to be moved, including material type, weight, density, and more.
Among the most important data related to on-site machinery is the capacity of loaders. Loader bucket capacity is a major factor in determining the speed of the production cycle.
The bucket capacity of a loader is the volume and weight of material its bucket can hold when fully loaded. This data comes from the equipment manufacturer. A bucket is fully loaded when a mound of the material rises above its top edge.
The fill factor of a loader or a haul truck is the degree to which it has been loaded to its full capacity. Fill factors come from actual operational data generated at a mine site. If a bucket has a fill factor of 90%, it is full to 90% of the maximum capacity its manufacturer has specified.
Capacities are fixed constraints for any piece of equipment. But fill factors, in contrast, are likely to vary from day to day and from one equipment operator to another. They can even vary by time of day.
Both capacities and fill factors are important data to generate accurate simulations.
Carolina also characterized the operating conditions at the site on a scale ranging from excellent to poor (Figure 11).
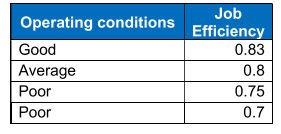
Figure 11. The digital model rated operating conditions at the mine by the relative job efficiency of the mine.
Next, she entered the average time to complete the cycle of loading a single haul truck. She got that data from the field or from performance handbooks provided by equipment manufacturers.
In the formulas she built into her spreadsheet, she made assumptions about these factors:
- Length of daily work shifts
- Number of days worked per week
- Daily production in tons
- Standard densities of sand and gravel
- Material inputs or fill factors
- Maximum production per cycle of, consistent with the maximum weight capacity of haul trucks at the site
3. Running various scenarios to generate data outputs
When the model is loaded with a set of data inputs, it calculates production outputs consistent with the inputs. The main outputs of the model are haul cycle times, material produced, and fuel consumed.
Figure 12 shows the detailed outputs of the model at various haul truck operating speeds. The text in Column A describes each metric. Column B shows the current value for each metric when haul trucks operate at the current average speed of 22 kilometers per hour (km/h).
To test other scenarios, Carolina changed the average operating speeds for haul trucks and noted the effects of the changes on new outputs.
Column C shows the new value for each metric if haul truck operating speed were increased to an average of 25 km/h. And Column D shows the values for each metric if the average haul truck speed increased to 30 km/h.
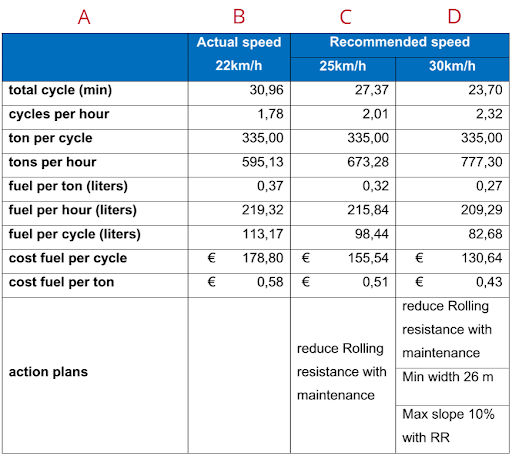
Figure 12. Carolina assembled a table to compare the outputs of two digital simulations against those of the mine’s current operation.
4. Comparing the results or outputs to see which scenario performed best
The simulations suggest that at a production volume of 5,000 tons, the mine could reduce its fuel cost per ton of ore hauled from 0.58 euros to 0.43 euros. That’s a reduction of 27% (Figure 13). The mine could achieve these savings by increasing the average speed of haul trucks from 22 kilometers per hour to 30 kilometers per hour.
The mine could safely increase haul truck speeds to 30 km/h by deploying changes along a designated stretch of its haul roads.
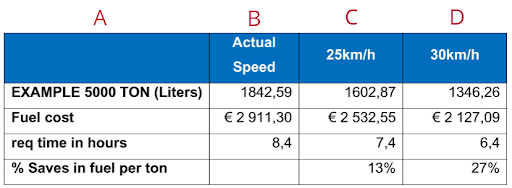
Figure 13. At a production of 5,000 tons, simulations suggest the mine could cut its fuel cost per ton by 27% by increasing the average haul truck speed by 8 km/h.
Summary and conclusions
This case study limits its scope to just two mining processes at a single mine site. It considers only loading and hauling operations.
The simulations suggest that this big open-pit copper mine can achieve a profitable balance among three key goals, all at the same time:
- Increase production
- Reduce operating expenses by cutting fuel consumption
- Reduce CO2 emissions
The simulations also suggest that the potential for improved performance is substantial.
By increasing production and reducing operating expenses, the operators can increase the operating profits of their site.
Caveats
Although the simulations point to opportunities for this mine to improve its operations, the mine has yet to implement the suggested actions. So the accuracy of the simulations has yet to be proved.
Mines with different operating conditions may not have similar opportunities to improve.
Before implementing such time-consuming or costly changes, the mine should consider additional scenarios and the economics of each.
For example, does the benefit of increasing average truck speed justify the cost of modifying the haul roads to enable faster truck speeds?
Additional modeling could provide answers to such questions.
Opportunities
Even with the preceding cautions, the study suggests these opportunities for mine and quarry operators:
1. You can benefit from optimizing loading and hauling processes. By doing so, you’re likely to improve three key performance metrics, including:
- Production
- Operating costs (by reducing fuel consumption)
- Carbon emissions
2. All mines and quarries can spot such opportunities by building effective digital models of their operations. You can build models by using software tools as simple as spreadsheets. And you can use the models to run simulations that optimize performance against multiple factors.
3. There needs to be a focus on the two elements most important for delivering reliable simulations:
- The quality of models used
- The quality of data used in the models
4. In production simulations, operators have relied heavily on performance specifications for the machinery they use on site. As accurate as that data is, it doesn’t vary from one site to another. Use of such standard data does not enable simulations to consider the many key production factors that vary from site to site.
5. The data elements that most influence the effectiveness of simulations are site specific. They include mine topology, the condition and geometry of haul roads, and data from telemetry. Until recently, detailed, accurate, and timely site-specific information was unavailable or too expensive to collect. But now you can collect, contextualize, process, and analyze detailed, site-specific data in Alteia’s vision AI platform. The cost is reasonable compared to the potential benefits, and implementation takes only a few weeks.
Suggested next action
To discuss how you can build models and simulations that incorporate your site-specific data, speak to an Alteia expert here.