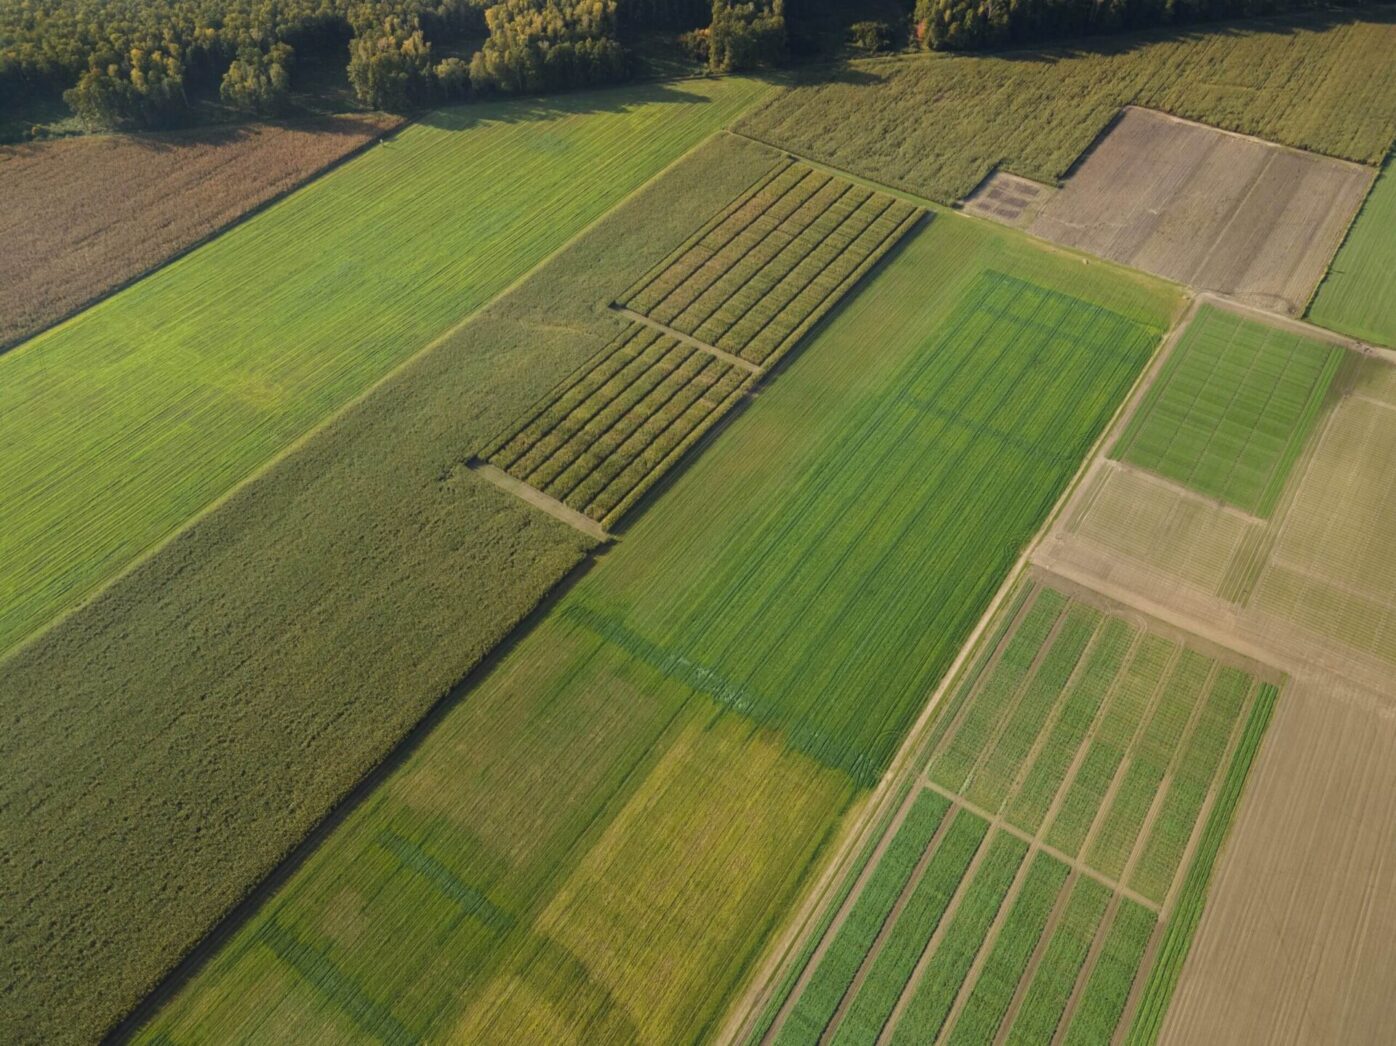
Digital phenotyping
Accelerate research and new product development thanks to the deployment of an efficient high-throughput crop characterization solution.
Enhance your digital phenotyping by first planning and managing resources and tasks related to data collection and processing. Then, you can ensure trait extraction from any type of visual data you use through standardization and automation. Finally, once the data has been collected, you can ensure its quality by running online and offline quality checks.
Making adjustments is simple - create or adjust your plot boundaries to match the physical edges of your fields. Then let the power of AI do the work. Once the algorithms have been created, you can deploy them across your software ecosystem to characterize plots. Then, visualize their traits and conduct deep-dive analysis by plant count, fcover, flowering characterization, and more.
You can continuously grow your dataset by linking your portfolio of tools and databases, ensuring efficient and secure data flows. In addition, the mobile application extension allows you to report visual or qualitative data continuously.
tools & features
Alteia’s SaaS applications leverage a suite of tools available at the platform level to enable high-value use cases quickly.
dc
dv
edc
udm
ma
dpm
3dpp
dct
um
mc
api
sdk
Leverage Alteia’s visual intelligence toolkit.
Discover the Alteia PlatformData inputs
- Any type of visual data, RGB, multispectral, hyperspectral, LiDAR, from various carriers such as drones, satellites, or robots.
- Plot plan (csv or vector).
- Infield plot observations.
Outputs
- Automated processing tasks.
- Seasonal plans with notifications.
- Plot boundaries.
- Extraction with stat line (raster, vector, and csv).
BUILD YOUR OWN APPLICATION
Sign up for a Free Demo.
For use cases specific to your activities, see how to develop your own applications or have our experienced team do it for you.
Schedule a call with an expert