Field trial analysis
A powerful and scalable plant phenotyping solution to support your digital transformation, reduce seed R&D cycles, and adapt to the challenges of climate change.
Contact usSimplified phenotyping
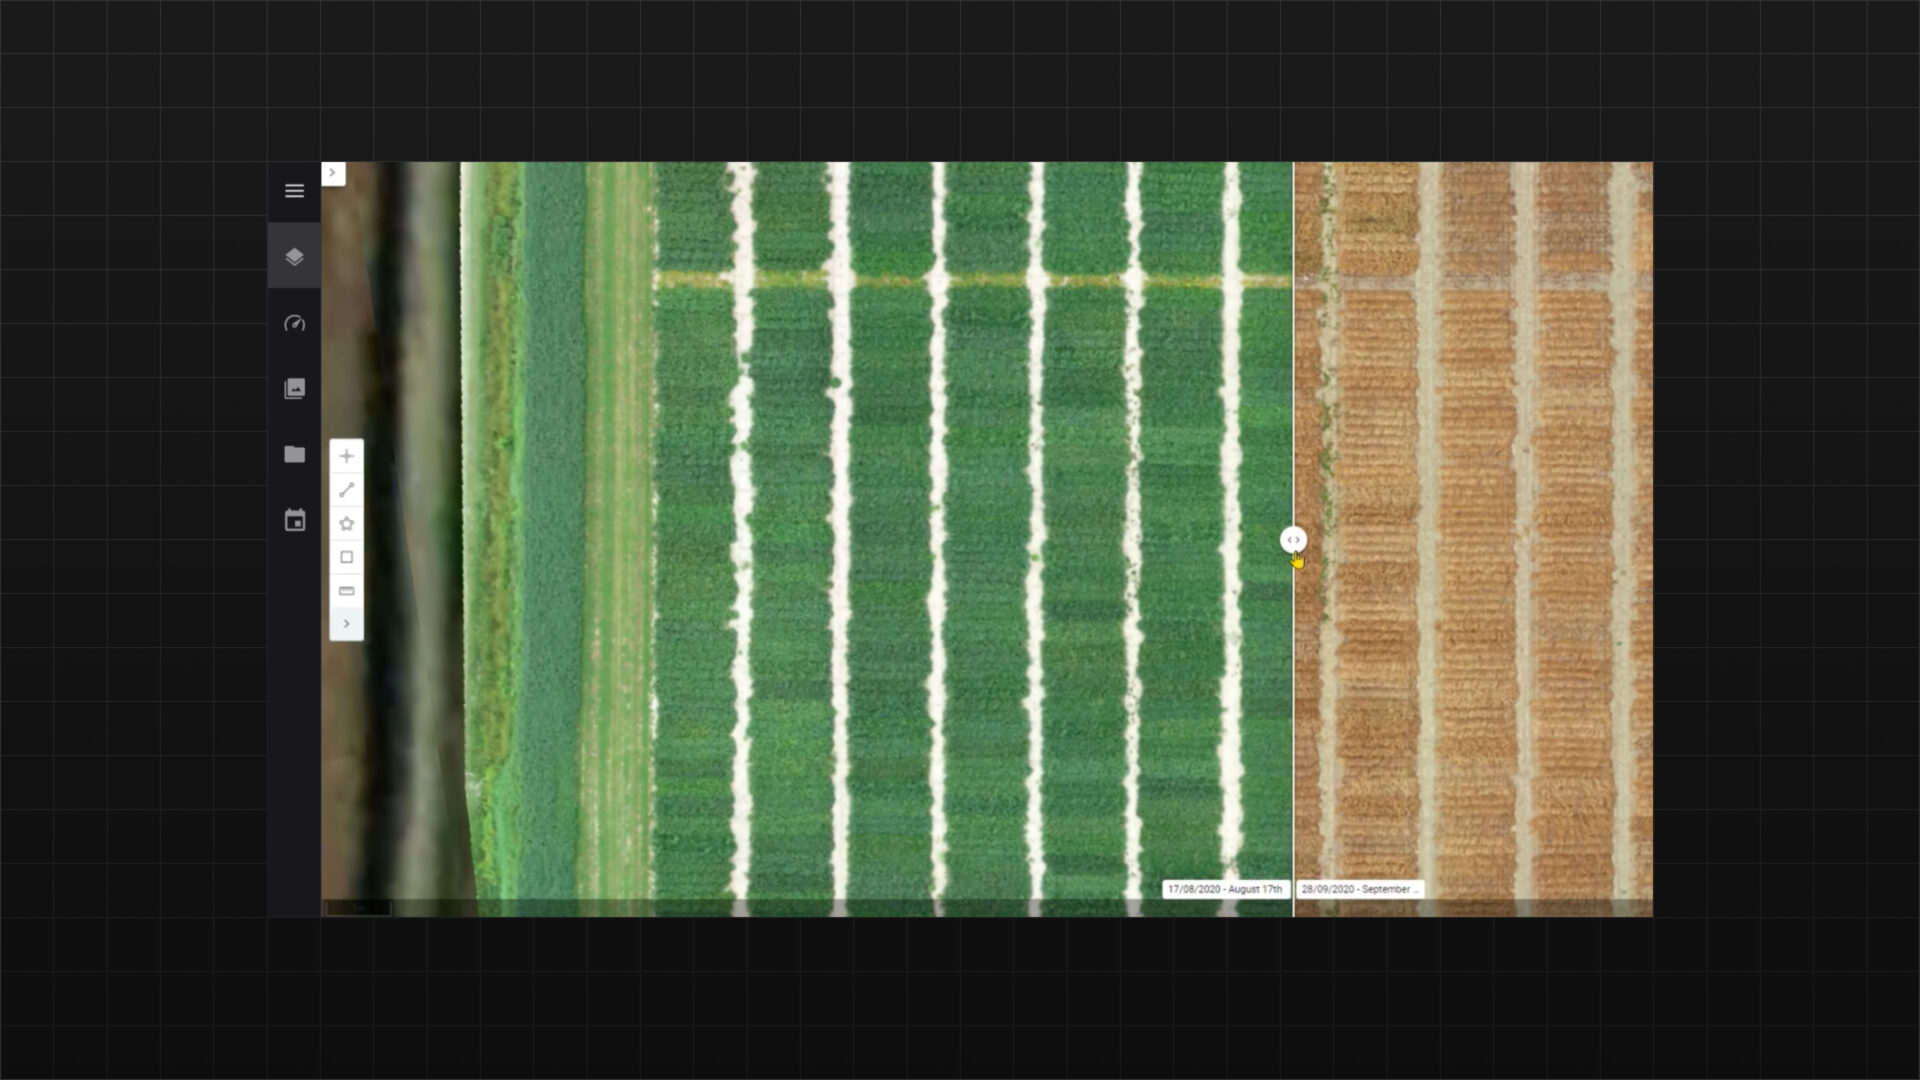
Alteia Field Trial Analysis simplifies digital phenotyping using visual data from drones, satellites, and cameras. It enhances crop assessments, automates data processing, and improves R&D efficiency by 30%. The platform supports scalable, automated data pipelines for diverse sensors, vectors, and crops, delivering valuable phenotypic insights and reports.
Automated and end-to-end data flow
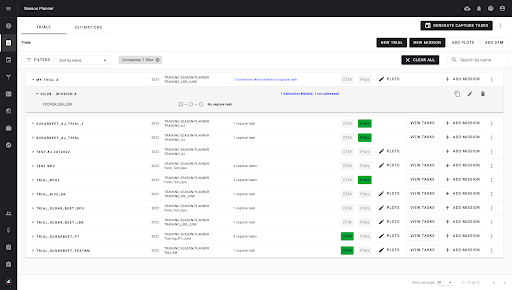
Automate your regular data collection and analysis with the integrated season planner module. This feature lets you automate data processing by defining the sequence of analyses, standardize processes across sites, and track task progress. The benefits include increased efficiency by reducing manual handling and errors, scalability to handle large data volumes without extra staff, and consistent data quality through predefined rules and algorithms.
Leverage embedded editing tools to create digital twins of your field trials
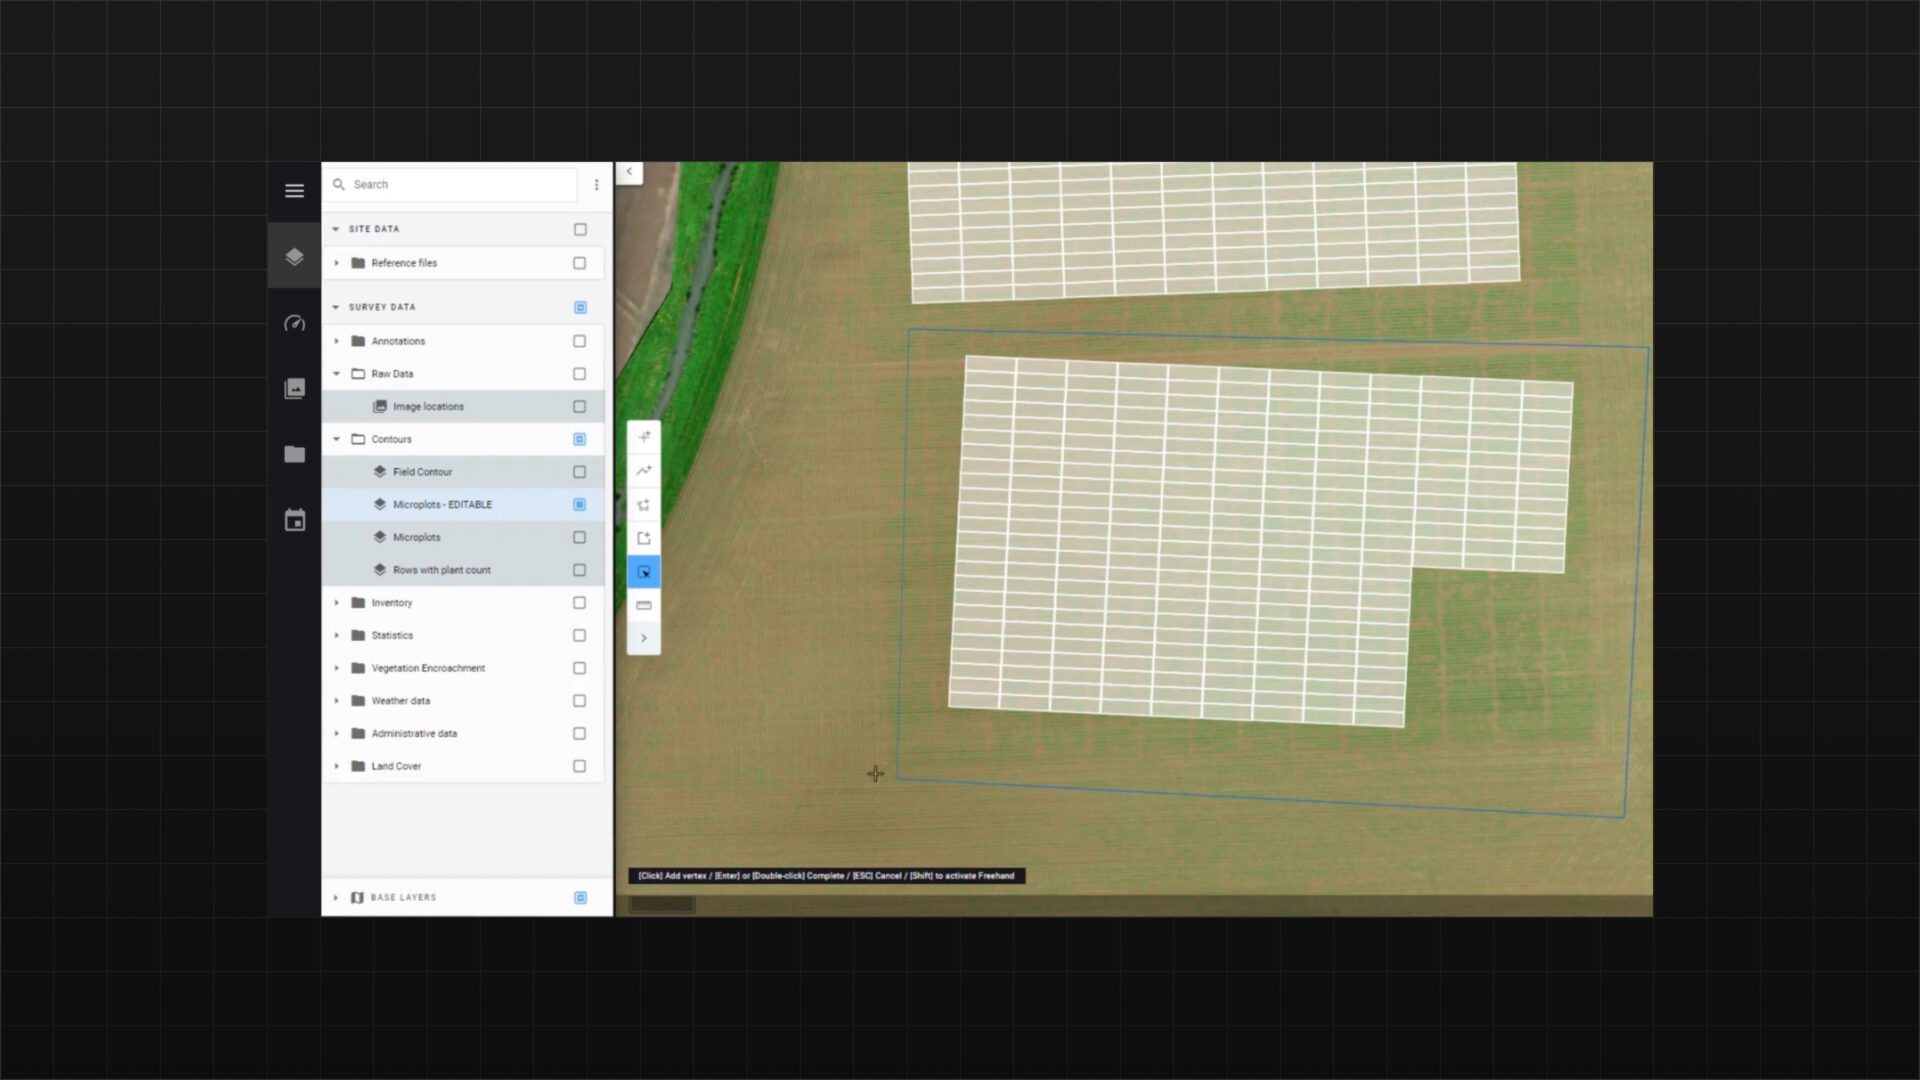
Create plot boundaries to measure, monitor, and evaluate traits and trial responses at the microplot level. Each microplot gets a custom ID for easy data analysis. The app provides tools to edit microplots (modify, delete, etc.), and you can also import microplot vector files created elsewhere.
Support decisions for field trial validation based on plant density/stand counts
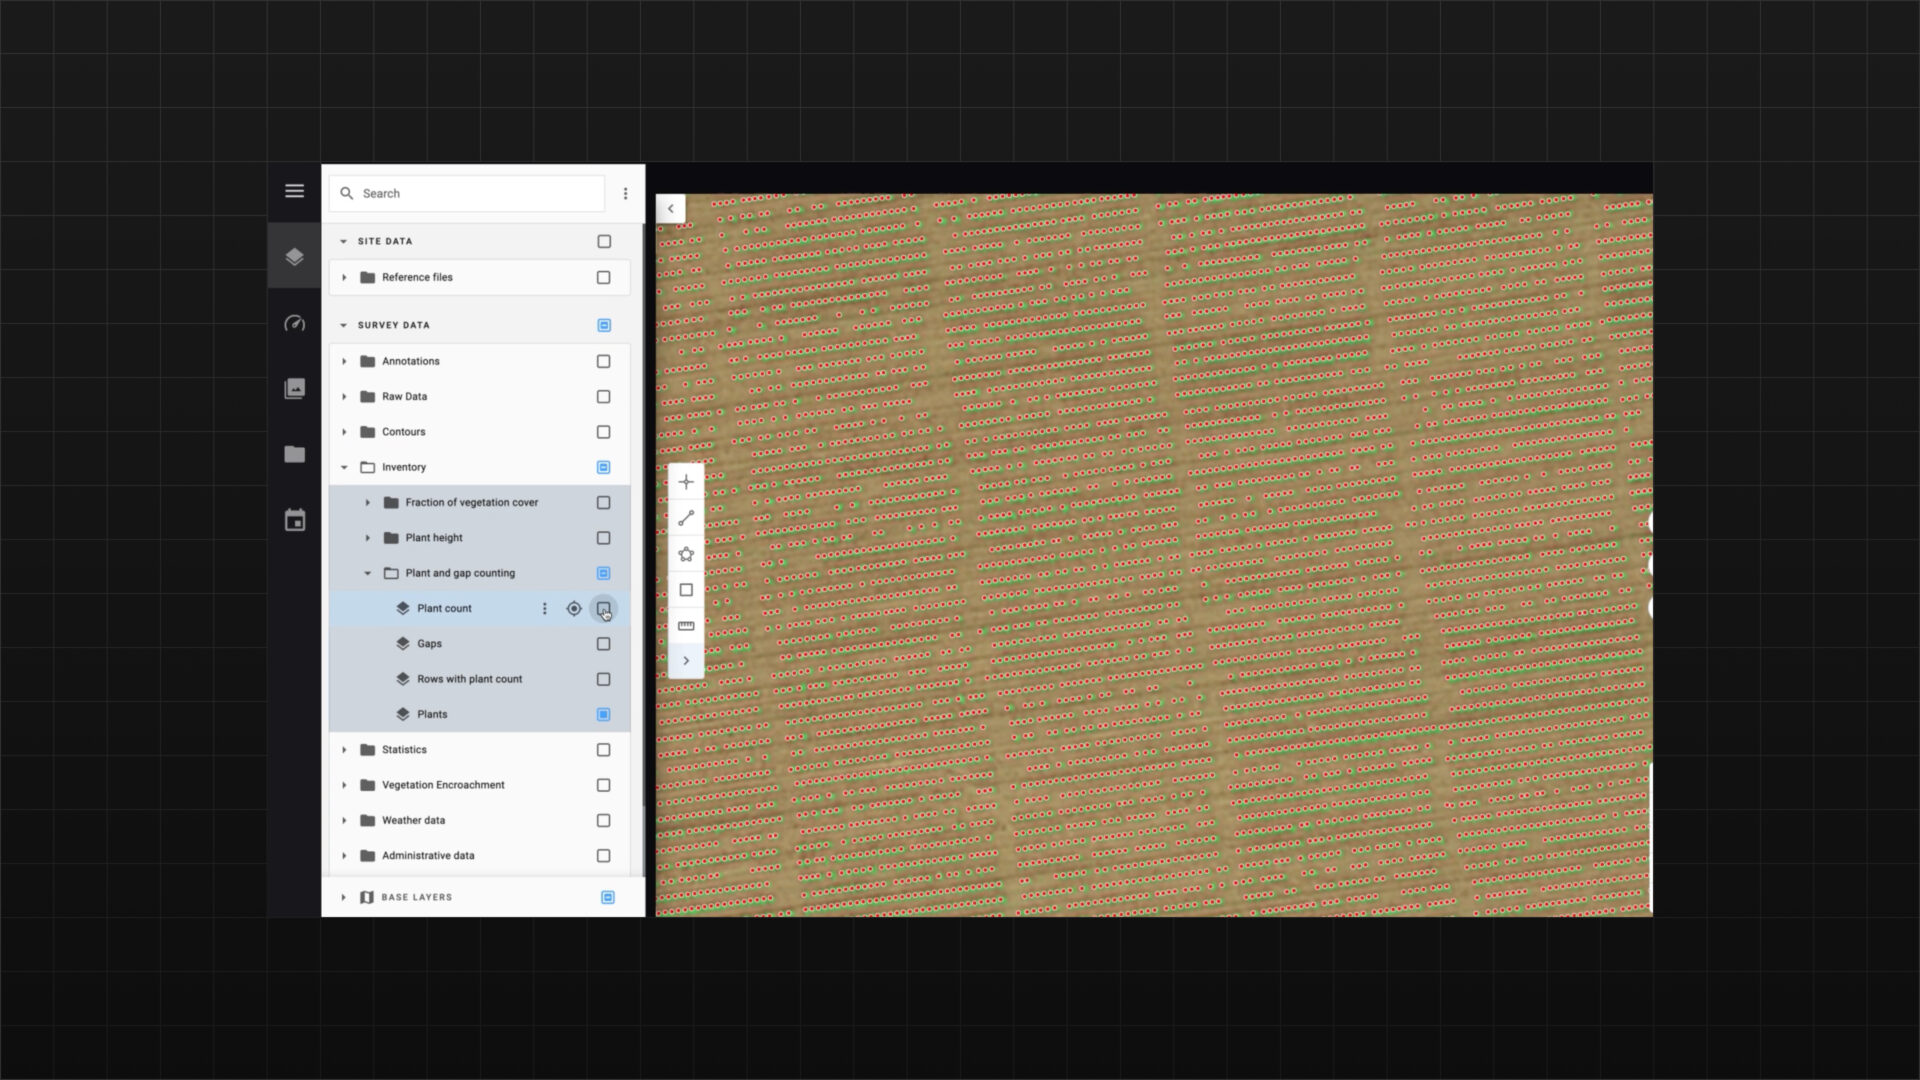
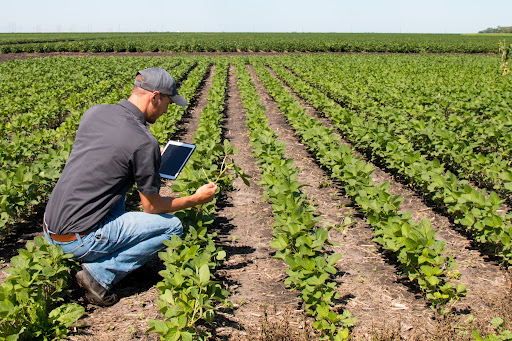
Plant density is crucial for understanding crop growth, guiding decisions, shaping strategies, and promoting sustainable farming, making it essential for field trial analysis. It indicates crop health and productivity and helps assess how environmental factors like weather and soil affect plant growth. While usually done manually, the Field Trial Analysis app uses AI to automate plant detection across varieties and aggregates data for statistical comparisons between plots and fields.
Automatize and standardize crop trait measurement process
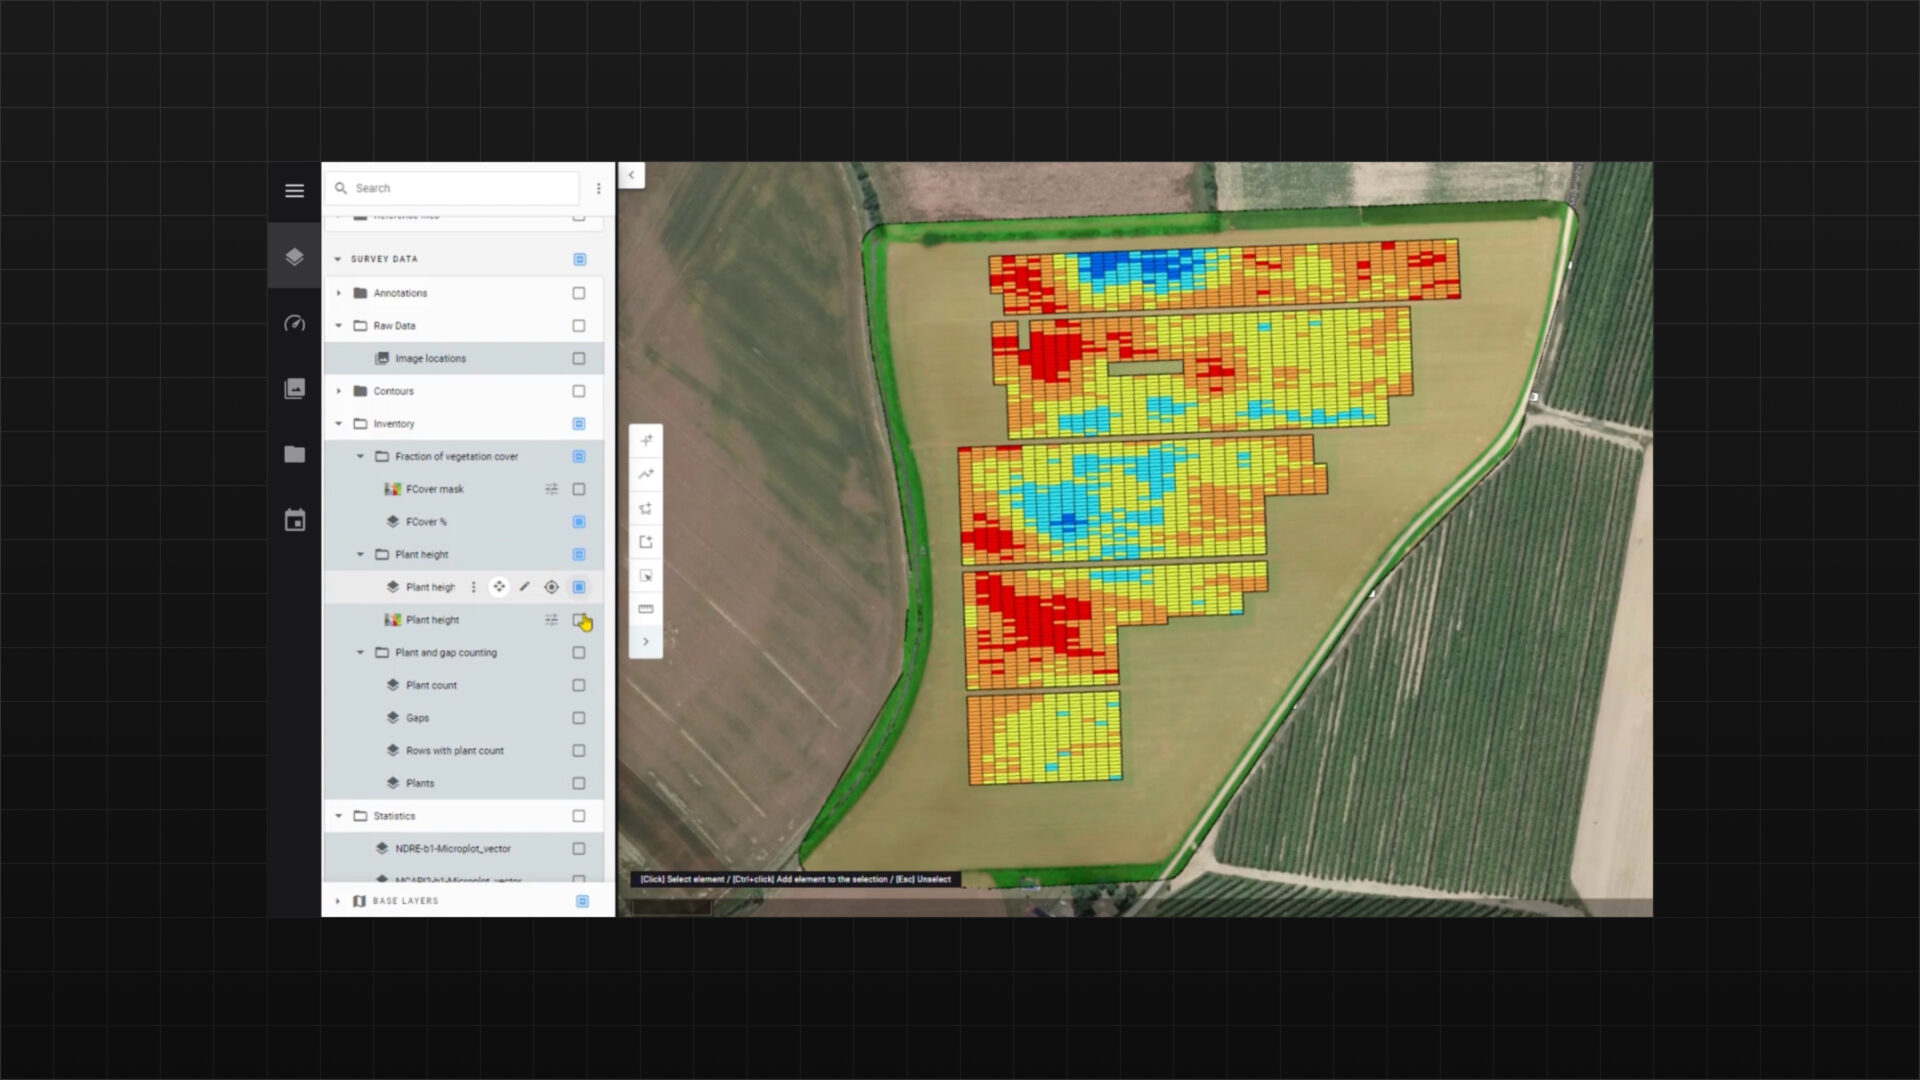
This feature generates vegetation indexes and computes statistics like flowering, plant height, plant count, and stay-green index at the microplot level. You can also create custom scouting maps and traits using specific formulas. Automating crop trait measurement reduces human error, ensures consistent and accurate data, and captures a broader range of traits, providing a deeper understanding of crop performance.
Evaluate quickly and consistently plant response to crop protection products
By monitoring crop growth and health over time, researchers can track changes in vegetation indices and other key indicators. Analyzing this data as a time series helps observe trends in crop behavior before and after applying protection products. This analysis shows the effectiveness of these products and their impact on crop health. It also helps identify the best application timings and dosages for more efficient and sustainable farming.
Record anomalies in your field experiment
Access data anytime, anywhere with the mobile app. Enable your agronomists to collaborate using annotation tools, create tasks, and assign them to teams. Use the app to simplify communication with mobile 2D/3D maps and to input new data or validate fieldwork.
Benefits
Optimize operations, enhance decision-making, and automate data processing and monitoring for improved efficiency and risk management. With flexible architecture and real-time insights, we enable businesses to integrate AI seamlessly, driving productivity and cost savings.

Share data across your organization
Provide your team with immediate insight into plot statuses. The application enables agronomists and data scientists to compare site and plot performance under various conditions, encouraging collaborative enhancements.

Reduce R&D costs and cycle times
Leverage the application to reduce analysis costs, deliver real-time data for improved team productivity, and streamline on-site operations with a visual progress timeline. This minimizes the need for ground truthing, giving agronomists more time for data analysis.

Save analysis time and scale up
The application automates key steps in the trait characterization workflow—from plot detection to processing drone data and generating reports on various indexes. This allows you to analyze more plots with fewer resources.

Reduce plant assessment variability
Ensure consistency across R&D sites by standardizing methods. Regularly compare and refine methods for better outcomes. Simplify the workflow from image acquisition to result interpretation with user-friendly apps, maintaining uniformity across all trials and research programs.
Technical features
Our application features advanced visual data analytics, real-time data processing, seamless integration with existing workflows, and scalable architecture.
Cloud-based
No need to install any software. Just log to your account and manage all your data from there, benefiting from elastic storage capabilities and high performance computing.
Annotation tools
Photogrammetry engines
Powerful analytics
Use our AI-powered analytics for microplot automated delimitation, vegetation index statistics extraction, plant count and emergence, and plant height measurement among others.

High level of customization
The application can be configured to your specific needs.

No programming required
No need for a data scientist or expensive custom programming.

Quick data turnaround
Your surveys and analytics are processed, QA’d, and ready to view within hours.

User-friendly layering
Apply and visualize the layers you want, and define specific styling or data intervals.
Vision data inputs
Pricing
- Up to 10 seats
- APIs for output integration only
- Pay per use for photogrammetry
- Pay per use for analytics run
- Online community and training
- Level 1 analytics integration
- Custom application development
- Access to SDK and APIs
- Advanced account management
- Premium support
- Season Planner and Data Capture
Industries
This Alteia application already helps the Agriculture industry and the following clients.