How vision AI enhances predictive analytics: examples from 5 industries
Visual intelligence, or vision AI, enables powerful uses of predictive analytics across many industry segments. Organizations can now predict and forecast the future in ways that were not possible a few years ago.
How can you use the relatively new tools of vision AI to predict and forecast the future? And how might you benefit from using vision AI to do so more accurately?
This article explores at a high level how vision AI expands the uses of predictive analytics. It also explains how it improves the accuracy of forecasts and routine predictions in five industries.
Before getting into specific industrial uses, let’s set the context:
- What are predictive analytics?
- What are the goals and benefits of predictive analytics?
- What are the differences between routine and complex predictions?
- What are the differences between predictions and forecasts?
What are predictive analytics?
Predictive analytics refers to a set of technologies and processes for projecting future events by analyzing data related to past events.
The processes of predictive analytics use historical information, statistical modeling, data mining techniques, and machine learning (ML) to find patterns in data.
Predictive algorithms use if, then logic. The if a portion of the logic states a hypothesis. The then portion states a conclusion that correlates with the hypothesis: If situation A occurs, then situation B is also likely to occur.
For statistical modeling, it’s not necessary to establish whether situation A causes situation B or whether situation B is a direct result of situation A. Instead, the algorithm calculates the probability that situation B will coincide with Situation A or that situation B will occur at a specified time after.
Why it’s so valuable to predict the future—even imperfectly
The future, of course, is never 100% predictable. But that doesn’t prevent organizations from trying to predict it with higher levels of confidence.
Some future conditions or events are more consistently predictable than others. It’s easier to accurately predict tomorrow’s weather than the price of an agricultural commodity in six months.
Despite the limitations of predictions, organizations can achieve great value and competitive advantage by understanding the probability that certain conditions or events will occur. When they can predict the future with a quantifiable level of confidence, organizations can identify opportunities and manage risks more effectively.
Across all industries, use of predictive analytics can help reduce operating costs. The ability to predict or forecast the future is especially valuable for companies that make big investments. They need a level of confidence that they will earn enough return to offset their risks.
For industries that invest heavily in physical assets, accurate predictions can improve resource management, predictive maintenance, and crop production forecasting.
How predictions are different from forecasts
Predictive analytics and forecasts share common characteristics, but the two involve different methods. All forecasts are predictions, but not all predictions are forecasts.
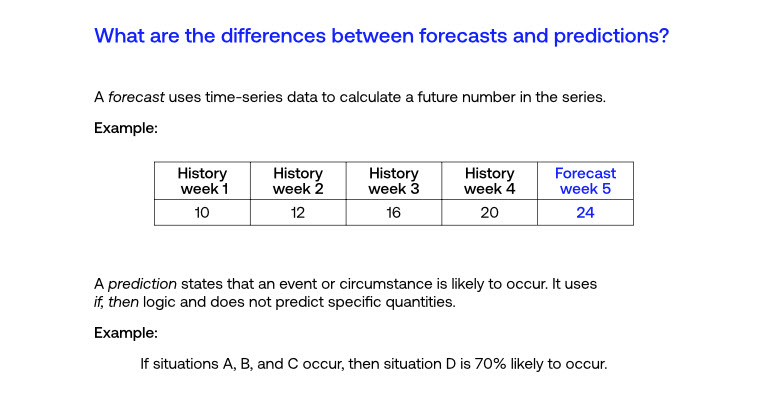
A forecast is a statistical projection of a number based on time-series data.
If a store has sold an average of five units of one item every month for a year, the store’s forecasting system may predict five units for the same item next month.
The accuracy of a forecast depends on these factors:
- The amount and detail of historical data
- The quality (cleanliness and accuracy) of the historical data
- The random variability of the data
- The number and complexity of factors that influence historical variation
- The sophistication of the forecasting model or algorithm.
In contrast to forecasts, predictions are not based on time-series data. They assign a probability that events or circumstances will occur. They do not predict quantities.
How AI excels at routine predictions
Humans are often better than AI at making predictions that involve complex causes and effects. Today AI cannot predict futures for which it has no historical precedent. Such predictions require intuition and imagination, two traits that AI lacks.
Even so, AI is much better than humans at finding patterns in data-rich environments where the past reliably predicts the future. Some data scientists call these routine predictions. [Source: The Business of Big Data: How to Create Lasting Value in the Age of AI. Uri Bram. Martin Schmalz. 2019.]
Routine predictions consider a relatively low number of correlated conditions.
If rust appears on a metal surface, it will continue to spread if left untreated. The speed of oxidation depends on the type of metal and the relative humidity of the environment. The process is highly predictable if you have accurate data about the alloy, the amount of rust and its location today, the relative humidity, and a small number of other factors. This is a routine prediction.
Conversely, the more complex the chain of causes, effects, and correlations, the harder it is to forecast or predict anything. These are complex predictions.
Artificial intelligence provides frameworks and models that enable computers to make routine predictions in huge volumes and with incredible speed.
What is the relationship between predictive analytics and vision AI?
Vision AI, a branch of artificial intelligence, enables use of visual data in predictive analytics. Vision AI is a valuable addition to predictive analytics because it enables organizations to draw new insights from visual data.
For related reading on the technologies behind vision AI please see these Alteia blog articles:
- Introductory Guide to Technologies for Visual AI
- The Role of Vision AI in Digital Transformation
- Point Cloud Classification and Machine Learning: An Introduction to Practical Uses in Visual AI
- The Challenges of Data Contextualization for Enterprise AI
The visual data may include digital images, photos, videos, laser scans, and other visual inputs from diverse sources. Systems can then use such visual data to make predictions, to generate forecasts, and even recommend specific actions.
Visual data improves predictive analytics for these reasons:
- Visual data is abundant. A huge amount of visual data is available through cameras and a wide variety of other sensors.
- Visual data is often relatively easy and inexpensive to capture. It’s collected through many different methods or vehicles (satellites, UAVs, robots, surface and marine vehicles, stationary fixtures, etc.) It can be captured remotely, reducing potential risks and dangers to humans.
- Visual data can be highly accurate and rich in detail. It can detect light at wavelengths that are invisible to human eyes, such as infrared. High-resolution laser scans can be accurate to within centimeters in a digital map that covers square kilometers. Microscopic images can capture the details of minute printed-circuit boards.
- Visual data is available in a rich variety of forms and formats. It can include both still and motion images, infrared images, LiDAR and other laser scans, multispectral images, and many more.
- Visual data can be combined with other forms of data to make it even more powerful. You can combine visual data with data collected from other kinds of sensors and from other databases. As you’ll see, you might merge data from a digital map with data from telematic sources and the internet of things (IoT).
Visual data brings new power to predictive analytics
With vision AI, computers can analyze many thousands of products or processes in seconds. They can notice defects or issues that are invisible to humans or are too complex, too detailed, or too fleeting for humans to see and process.
With well-established algorithms and models, AI can translate raw visual data into indices such as a ground cover index (FCover), which measures the density of vegetation on a plot of ground. It can also determine the health of plants by measuring their chlorophyll level as captured through multispectral imaging.
Unlike humans, vision AI is highly consistent. It never gets tired or distracted.
Humans are likely to miss or overlook important details. Machines can gather visual data from places that are inaccessible or dangerous to humans.
Computers can recognize patterns and measure statistical correlations much better than humans. They can see statistical patterns that are invisible to us and can process mathematics vastly faster.
Examples of predictive analytics in 5 industry segments
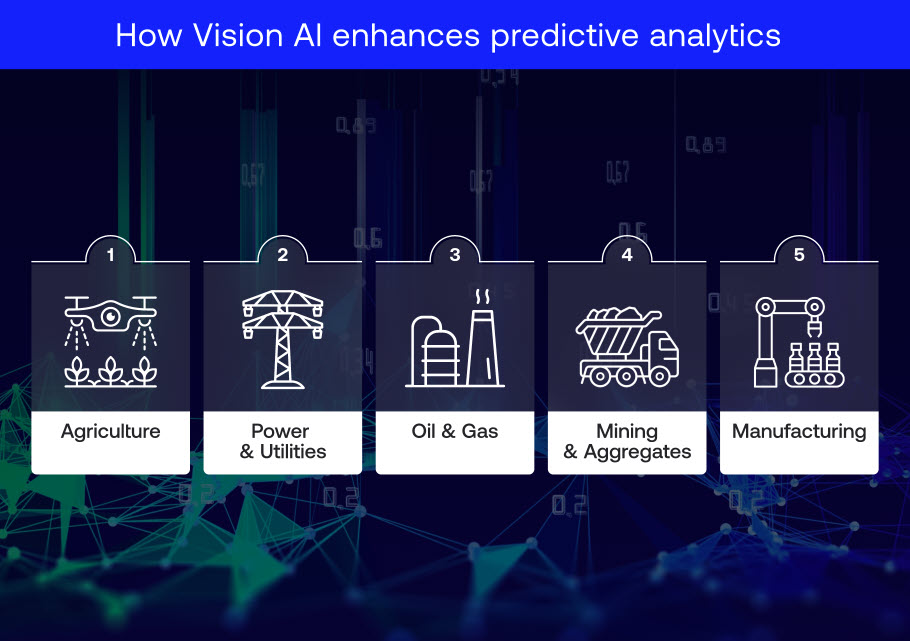
Agriculture: Forecasting crop seed production
Crop breeders are challenged to develop crop varieties that can thrive in local climates that are changing fast. Research cycles for new crop genetics often take 10 years or more. The cycle starts with the creation of a new variety. It includes years of field testing in carefully monitored micro plots. The commercialization phase includes production of crop seeds for distribution and sale to farmers.
For related reading, please see the Alteia blog article Three High-Value Uses of Visual AI in Agriculture.
Breeders produce seeds for sale through a network of growers who work under contract. The contractors grow seed crops in diverse locations and growing conditions in many countries.
Across these countries, breeders must forecast local seed production to meet local demand and plan distribution and logistics.
The success of seed production, like that of any crop, varies with local weather and field conditions. So it’s important for growers to monitor local crop growth from planting through harvest.
Breeders can help local growers increase the yield of a seed crop by detecting problems early and recommending prompt remedial action. Is a field infested by weeds? Are crops damaged by insects, diseases, or insufficient water? Have storms or floods wiped out part of a field?
Until recently, it has been hard for seed producers to gather detailed, accurate, and timely information about the health of seed crops. That’s because growers’ farm plots are geographically dispersed, data collection was slow and expensive, and it took a long time to gather and analyze data consistently from plot to plot.
But now use of vision AI and predictive analytics enables seed breeders to forecast the production of crop seeds much more accurately. They can do so by monitoring the growth and health of seed-producing crops at each grower’s plots, then forecasting yields and consolidating them across growers and geographies.
The producers use algorithms to forecast production for individual farms, and then they aggregate production for all farms.
With time-series data, vision AI algorithms can monitor changes in crop conditions. Other algorithms can then correlate crop and field conditions with the eventual seed yields.
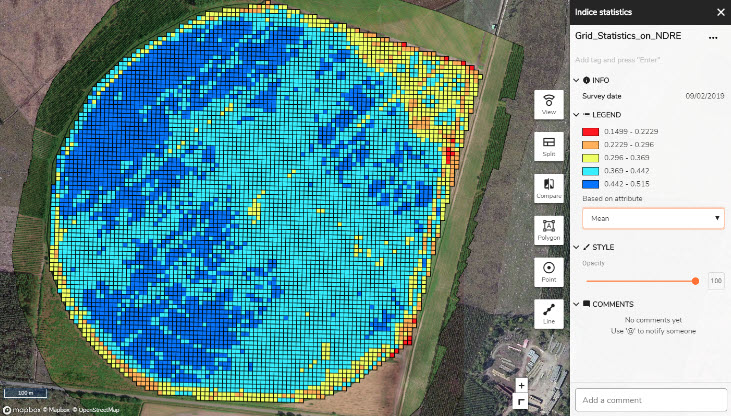
Depending on the frequency of data refreshes, breeders can get fast updates to their projections.
Breeders can license third-party algorithms and models, or they can create their own models to adapt vision AI to forecast the production of many different crops.
Power & Utilities: Managing vegetation growth to prevent power outages and wildfires
When vegetation grows too near to power lines and electrical equipment, it can cause wildfires and power outages.
For many companies that distribute electrical power, vegetation control can cost tens of millions of dollars. Some big distributors spend more than a hundred million dollars a year.
If companies don’t maintain vegetation properly, they can face huge fines and financial liabilities.
Power companies must manage five challenging processes:
- Gathering and consolidating huge amounts of data from very big geographic areas
- Measuring the proximity of vegetation to thousands of miles of power lines and electrical equipment
- Monitoring and predicting the growth of vegetation
- Deploying crews to trim growth before it causes problems
- Tracking the crews to verify they’ve trimmed vegetation properly
Some power companies now use vision AI and predictive analytics to forecast vegetation growth.
They gather data about power lines and vegetation through periodic flights by unmanned aerial vehicles (UAVs). They use LiDAR scanning technology to create a digital twin of their power network. Then machine learning distinguishes among vegetation, transmission lines and towers, buildings, ground, and electrical equipment.
Vision AI measures the distance between vegetation and power equipment, and the system alerts operators where trimming is needed. It automatically dispatches a local contractor and pinpoints where and how much to trim based on a forecast of future growth.
Next, the system checks the contractor’s work to verify compliance with regulations and safety standards. Finally, it triggers payment for work properly completed.
Rather than trimming all vegetation on regularly scheduled cycles of several years, operators can save tens of millions of dollars by deploying contractors to trim only as needed.
Predictive maintenance in utilities and other asset-intensive industries
Vision AI can also enhance predictive analytics to avoid expensive failures that halt production or require costly emergency repairs.
Vision AI algorithms can process data to analyze wear and tear and to forecast likely causes of failure.

A power transmission company has trained an Alteia vision AI system to recognize defects in electrical insulators. The system then alerts operators to repair or replace the components before they fail, potentially causing an interruption of power.
Oil & gas: Forecasting encroachment of desert sand
Oil and gas facilities that operate in desert regions face the continual threat of equipment damage from sand encroachment.
Predictive analytics with vision AI can track the movement of sand masses over time. Time- series photography and video images enable vision AI algorithms to plot likely drift patterns. The system can then assess the likelihood that encroaching sand masses will interfere with oil production facilities.
Alteia’s vision AI platform enables site managers to correlate their visual findings with inputs from other sources. Satellite imagery, weather data, and other information can improve accuracy by feeding predictive algorithms with a holistic view of the environment.
Mines & quarries: Predicting the effects of haul road optimization on production, CO2 emissions, and fuel use
Mining companies incur 30% to 50% of their operating cost on maintaining their plant, fleet, and equipment. [Source: “Behind the mining productivity upswing: Technology-enabled transformation.” McKinsey & Company.]
Many mines are in areas that are remote and relatively inaccessible to repair crews. And equipment downtime causes very expensive disruptions of production. For these reasons and others, urgent repairs and unscheduled maintenance work cost mining companies three to five times more than planned maintenance.
To reduce these high costs, progressive mines and quarries use vision AI to forecast the need for maintenance so they can schedule it in advance.
Mine and quarry operators also use vision AI and predictive analytics to model the effects of haul road optimization on mine production, CO2 emissions, and fuel use.
For reading on related topics, please see these Alteia blog articles:
- How the Eramet Group Uses Visual AI to Enable its Digital Transformation
- Optimizing Production in Open-Pit Mines: Digital Models and Simulations Using Vision AI as a Data Source
- The Role of Artificial Intelligence in Digital Transformation
A vision AI system receives LiDAR data from drones to make a highly accurate digital surface map of the mine or quarry.
The system also receives time-series data about the condition of haul trucks, their location, and the behavior of their drivers. Telematic sensors in the trucks send alerts about tire condition, the longevity of suspension systems, and the degree of wear. Sensors also report engine speed, truck speed, fuel consumption, and other data.
Alteia’s vision AI platform superimposes data from the haul trucks onto a 3D map of the haul roads. Heat maps show where the stress on haul trucks is greatest.
Sensors on the trucks also send alerts when parts of the trucks are under stress. This enables maps to show where road maintenance could reduce stress on trucks and cut maintenance costs.

By optimizing haul roads, mine and quarry operators can reduce maintenance costs, fuel consumption, and CO2 emissions. They can also improve the safety of haul roads.
Manufacturing: Finding sources of defects in manufacturing processes
Manufacturers now use machine learning and vision AI to predict defects and improve production processes.
On assembly lines, manufacturers mount video cameras at workstations to capture manual work in real-time. They use vision AI to analyze the videos and find correlations between defects and specific manufacturing processes. They then use the correlations to predict the likelihood of failure for individual components.
This capability is especially important for parts, components, or products that are expensive or whose reliability is critical—such as medical devices or equipment.
The similar analysis enables manufacturers to improve quality control overall. They compare test results at the end of production lines with video streams captured throughout manufacturing and assembly processes. Such analysis enables them to improve steps that are highly correlated with defects.
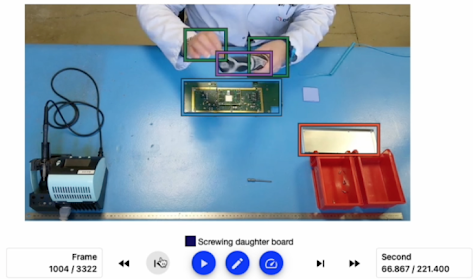
Machine learning enables computers to excel at predicting failures. They can improve indefinitely, without human involvement.
In summary
Recent advancements in artificial intelligence have made predictive analytics more powerful, accurate, flexible, and useful. Now vision AI enables organizations to use visual data for new, high-value uses of predictive analytics in several industries.
Organizations have used vision AI for more than a decade in consumer-facing sectors. Familiar uses are in retailing, healthcare, sports, entertainment, and the auto industry.
More recently, asset-intensive, heavy industries are discovering how they can also deploy vision AI and predictive analytics for newer applications:
- Resource and process optimization
- Predictive maintenance
- Forecasting of crop yields
- Monitoring of manufacturing processes to control quality and predict product failures
Putting vision Ai into practice with predictive analytics
Many organizations lack computer vision labs. Or they don’t have the skills and resources to create predictive analytics models. They may also lack the compute power needed to process huge sets of visual data.
For organizations of all sizes, use of an established, proven platform for visual intelligence can help. You can develop applications faster and at lower cost than you can do on your own.
Alteia is one of the few companies in the world that offers a comprehensive platform that enables big companies to manage all facets of vision AI.
With Alteia’s Platform as a Service (PaaS), you can combine data from diverse sources. You can overlay the data in rich visual displays that are fast and easy for users to understand.
For enterprise companies, use of the Alteia platform enables you to create, implement, and deploy vision AI applications in a few weeks.
For small to medium-sized enterprises (SMEs), Alteia offers 12 Software as a Service (SaaS) applications. These are designed for specific uses across nine industries.
Let Alteia help your organization win with vision AI at whatever pace or scale suits you.
To speak with an Alteia expert, contact us here.